A box and whiskers plot (in the style of Tukey)
geom_boxplot2.RdAll credits to @kongdd https://github.com/rpkgs/Ipaper
Usage
geom_boxplot2(
  mapping = NULL,
  data = NULL,
  stat = "boxplot",
  position = "dodge2",
  ...,
  outlier.colour = NULL,
  outlier.color = NULL,
  outlier.fill = NULL,
  outlier.shape = 19,
  outlier.size = 1.5,
  outlier.stroke = 0.5,
  outlier.alpha = NULL,
  show.errorbar = TRUE,
  width.errorbar = 0.7,
  notch = FALSE,
  notchwidth = 0.5,
  varwidth = FALSE,
  na.rm = FALSE,
  show.legend = NA,
  inherit.aes = TRUE
)
Arguments
- mapping
mapping
- data
data
- stat
stat
- position
position
- ...
...
- outlier.colour
outlier.colour
- outlier.color
outlier.color
- outlier.fill
outlier.fill
- outlier.shape
outlier.shape
- outlier.size
outlier.size
- outlier.stroke
outlier.stroke
- outlier.alpha
outlier.alpha
- show.errorbar
boolean
- width.errorbar
width of errorbar.
- notch
If `FALSE` (default) make a standard box plot. If `TRUE`, make a notched box plot. Notches are used to compare groups; if the notches of two boxes do not overlap, this suggests that the medians are significantly different.
- notchwidth
For a notched box plot, width of the notch relative to the body (defaults to `notchwidth = 0.5`).
- varwidth
If `FALSE` (default) make a standard box plot. If `TRUE`, boxes are drawn with widths proportional to the square-roots of the number of observations in the groups (possibly weighted, using the `weight` aesthetic).
- na.rm
na.rm
- show.legend
show.legend
- inherit.aes
inherit.aes
Examples
df <- data.frame(
x = sample(LETTERS[1:3], prob = 1:3, size = 1000, replace = TRUE),
y = rgamma(1000, shape = 1)
)
df <- data.frame(
x = sample(LETTERS[1:3], prob = 1:3, size = 1000, replace = TRUE),
y = rt(1000, df = 3)
)
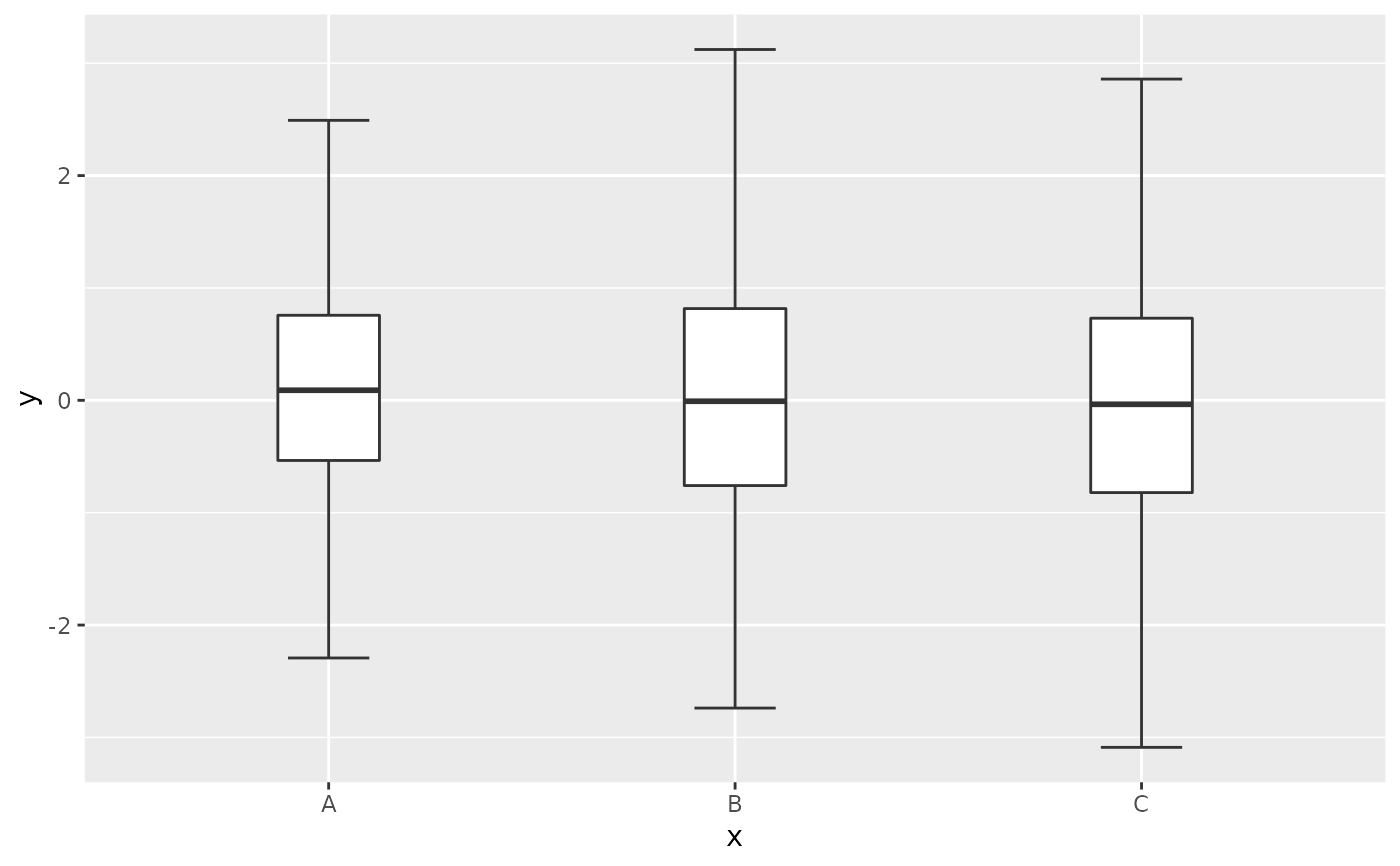
ggplot(df) +
geom_boxplot(aes(x, y))
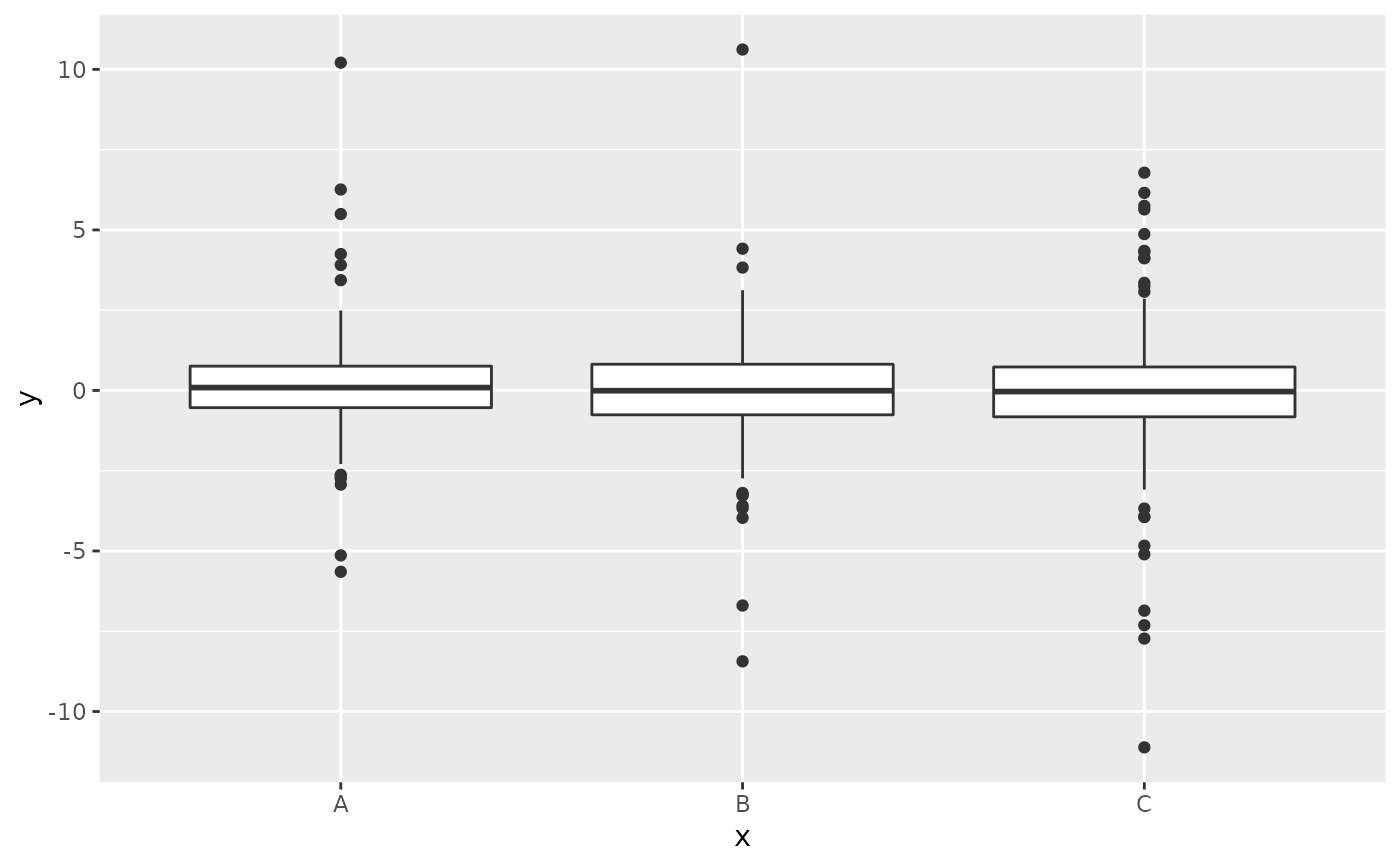 ggplot(df) +
geom_boxplot2(aes(x, y))
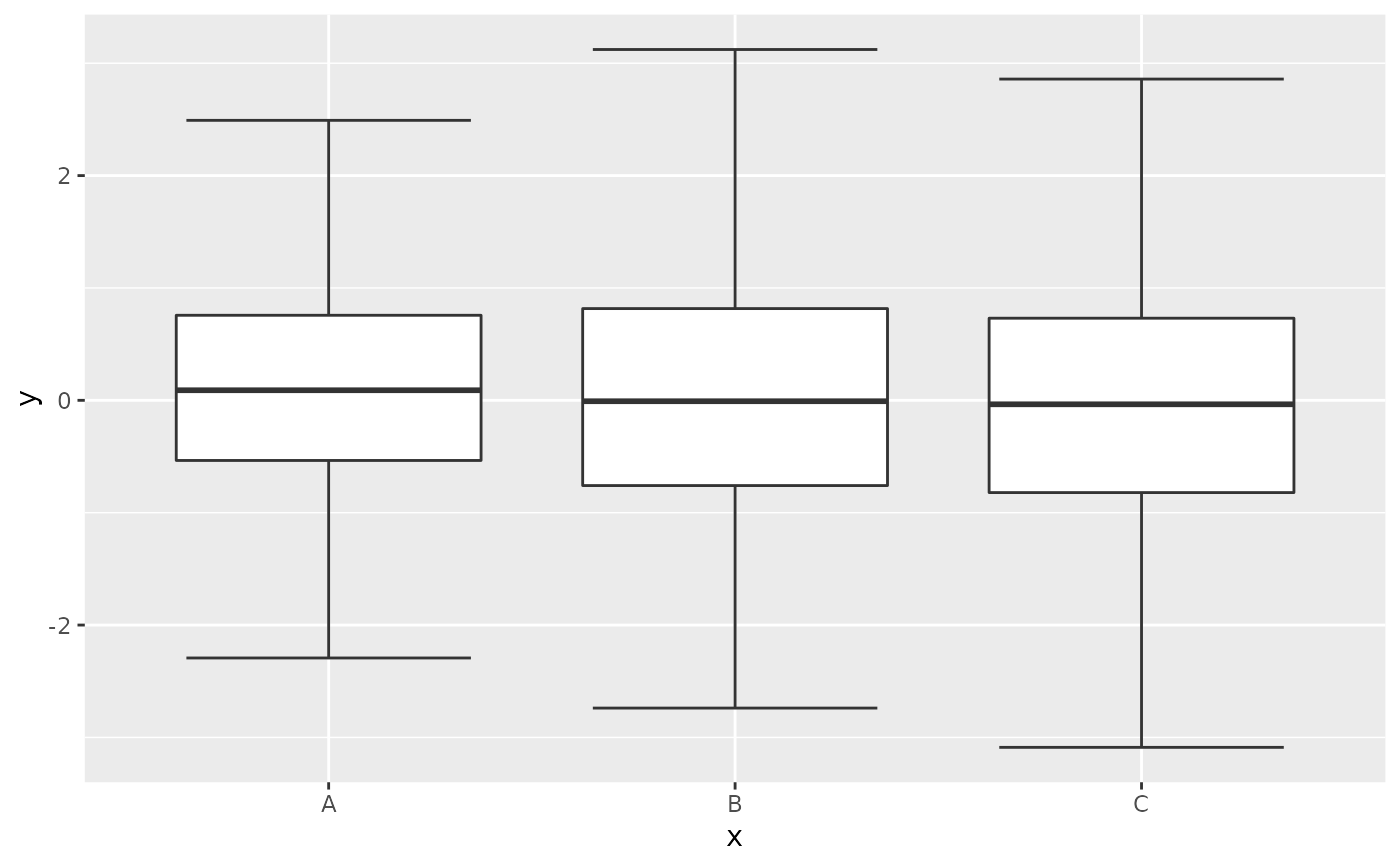
ggplot(df) +
geom_boxplot2(aes(x, y))
 ggplot(df) +
geom_boxplot2(aes(x, y), width.errorbar = 0.2, width = 0.25)
ggplot(df) +
geom_boxplot2(aes(x, y), width.errorbar = 0.2, width = 0.25)