Computación Estadística con R
Manipulación de Datos
Joshua Kunst
Manejo de Datos
Antes el %>%
Ir a RStudio. Yay!
Importar datos
## # A tibble: 6 x 4
##   storm    wind pressure date
##   <chr>   <dbl>    <dbl> <date>
## 1 Alberto   110     1007 2000-08-03
## 2 Alex       45     1009 1998-07-27
## 3 Allison    65     1005 1995-06-03
## 4 Ana        40     1013 1997-06-30
## 5 Arlene     50     1010 1999-06-11
## 6 Arthur 45 1010 1996-06-17## # A tibble: 6 x 3
## city size amount
## <chr> <chr> <dbl>
## 1 New York large 23
## 2 New York small 14
## 3 London large 22
## 4 London small 16
## 5 Beijing large 121
## 6 Beijing small 56filter Seleccionar Filas

filter Ejemplo

filter Código
filter(storms, storm %in% c("Alberto", "Ana"))## # A tibble: 2 x 4
## storm wind pressure date
## <chr> <dbl> <dbl> <date>
## 1 Alberto 110 1007 2000-08-03
## 2 Ana 40 1013 1997-06-30select Seleccionar Columnas

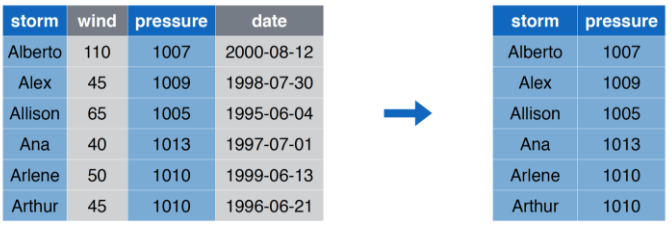
select Ejemplo
select Código
select(storms, storm, pressure)## # A tibble: 6 x 2
## storm pressure
## <chr> <dbl>
## 1 Alberto 1007
## 2 Alex 1009
## 3 Allison 1005
## 4 Ana 1013
## 5 Arlene 1010
## 6 Arthur 1010Versión alternativa
## # A tibble: 6 x 2
##   storm   pressure
##   <chr>      <dbl>
## 1 Alberto     1007
## 2 Alex        1009
## 3 Allison     1005
## 4 Ana         1013
## 5 Arlene      1010
## 6 Arthur 1010arrange Ordenar Filas
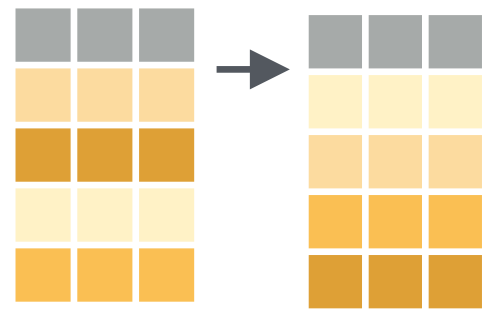
arrange Ejemplo

arrange Código
arrange(storms, wind)## # A tibble: 6 x 4
## storm wind pressure date
## <chr> <dbl> <dbl> <date>
## 1 Ana 40 1013 1997-06-30
## 2 Alex 45 1009 1998-07-27
## 3 Arthur 45 1010 1996-06-17
## 4 Arlene 50 1010 1999-06-11
## 5 Allison 65 1005 1995-06-03
## 6 Alberto 110 1007 2000-08-03mutate Crear/Modificar columnas

mutate Ejemplo

mutate Código
mutate(storms, ratio = pressure/wind, inverse = 1/ratio)## # A tibble: 6 x 6
## storm wind pressure date ratio inverse
## <chr> <dbl> <dbl> <date> <dbl> <dbl>
## 1 Alberto 110 1007 2000-08-03 9.15 0.109
## 2 Alex 45 1009 1998-07-27 22.4 0.0446
## 3 Allison 65 1005 1995-06-03 15.5 0.0647
## 4 Ana 40 1013 1997-06-30 25.3 0.0395
## 5 Arlene 50 1010 1999-06-11 20.2 0.0495
## 6 Arthur 45 1010 1996-06-17 22.4 0.0446summarize Resumir Columnas
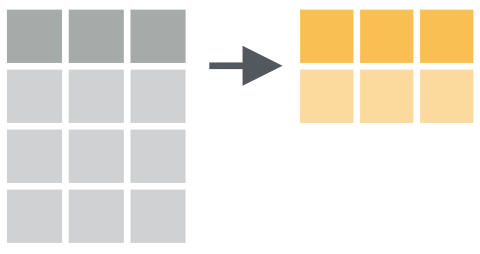
summarize Ejemplo
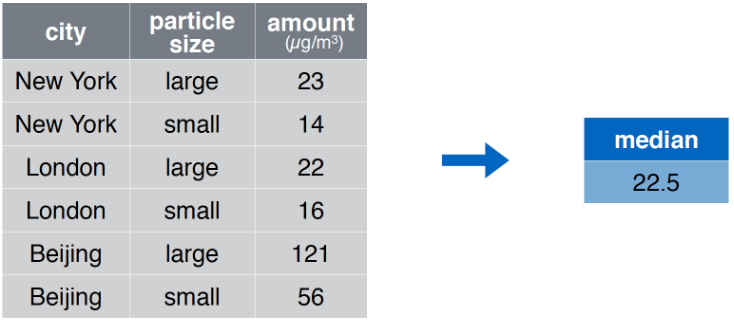
summarise Código
summarise(pollution, median = median(amount))## # A tibble: 1 x 1
## median
## <dbl>
## 1 22.5group_by + summarize Resumir Columnas por Grupos
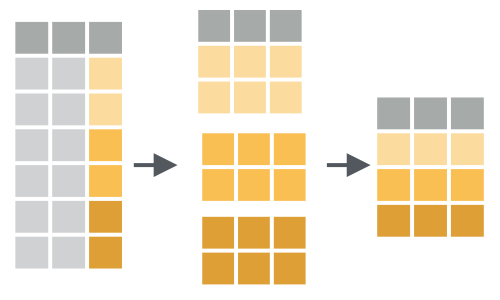
group_by + summarize Ejemplo
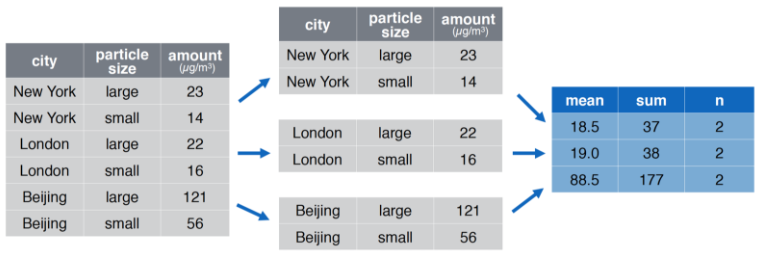
group_by + summarise Código
pollution %>%
  group_by(city) %>%
  summarise(
    promedio = median(amount),
    suma = sum(amount),
    n = n()
    )
## # A tibble: 3 x 4
## city promedio suma n
## <chr> <dbl> <dbl> <int>
## 1 Beijing 88.5 177 2
## 2 London 19 38 2
## 3 New York 18.5 37 2Ejercicios
Revisemos el archivo 03-script-manipulacion-datos-01.R
Con el archivo de http://datos.gob.cl/dataset/28198
- ¿Cuatos registros y filas tiene la tabla?
- ¿Cual es la comuna con mas puntos BIP!?
- ¿Cual es la entidad/comuna menos repetida?
- ¿Cuantos centros BIP existen en La Florida?
Manejo de Datos 2
Importar datos
## # A tibble: 4 x 2
##   song                name
##   <chr>               <chr>
## 1 Across the Universe John
## 2 Come Together       John
## 3 Hello, Goodbye      Paul
## 4 Peggy Sue Buddy## # A tibble: 4 x 2
## name plays
## <chr> <chr>
## 1 George sitar
## 2 John guitar
## 3 Paul bass
## 4 Ringo drumsleft_join Juntar tablas
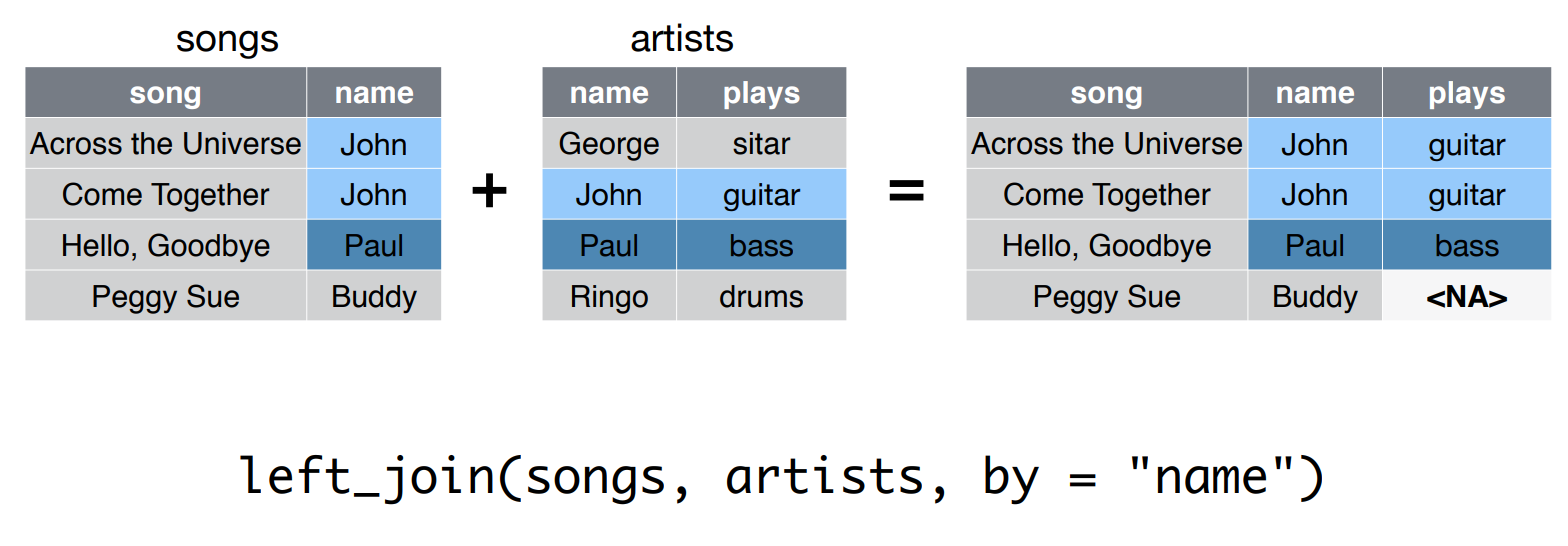
left_join Código
## # A tibble: 4 x 3
##   song                name  plays
##   <chr>               <chr> <chr>
## 1 Across the Universe John  guitar
## 2 Come Together       John  guitar
## 3 Hello, Goodbye      Paul  bass
## 4 Peggy Sue           Buddy <NA>
Importar datos 2
## # A tibble: 3 x 3
##   country     `1999` `2000`
## * <chr>        <int>  <int>
## 1 Afghanistan    745   2666
## 2 Brazil       37737  80488
## 3 China 212258 213766## # A tibble: 12 x 4
## country year type count
## <chr> <int> <chr> <int>
## 1 Afghanistan 1999 cases 745
## 2 Afghanistan 1999 population 19987071
## 3 Afghanistan 2000 cases 2666
## 4 Afghanistan 2000 population 20595360
## 5 Brazil 1999 cases 37737
## 6 Brazil 1999 population 172006362
## 7 Brazil 2000 cases 80488
## 8 Brazil 2000 population 174504898
## 9 China 1999 cases 212258
## 10 China 1999 population 1272915272
## 11 China 2000 cases 213766
## 12 China 2000 population 1280428583## # A tibble: 3 x 4
## country `2011` `2012` `2013`
## <chr> <dbl> <dbl> <dbl>
## 1 FR 7000 6900 7000
## 2 DE 5800 6000 6200
## 3 US 15000 14000 13000¿Como obtendríamos el promedio por país?
¿Como obtendríamos el promedio por país?
## # A tibble: 3 x 5
##   country `2011` `2012` `2013` promedio
##   <chr>    <dbl>  <dbl>  <dbl>    <dbl>
## 1 FR        7000   6900   7000    6967.
## 2 DE        5800   6000   6200    6000
## 3 US       15000  14000  13000   14000
Ahora pensemos en una tabla más grande, con más años
gather Recolectar
Coloca nombres de columnas en una variable (columna) key, recolectando los valores (value) de las columnas en un sola columna
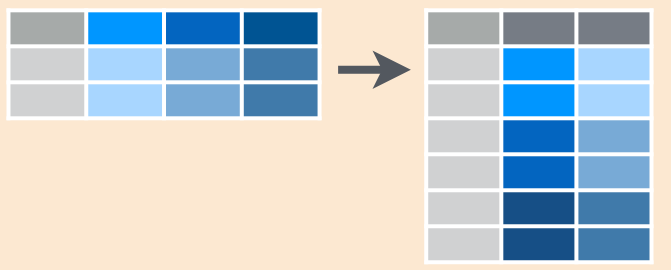
gather Ejemplo
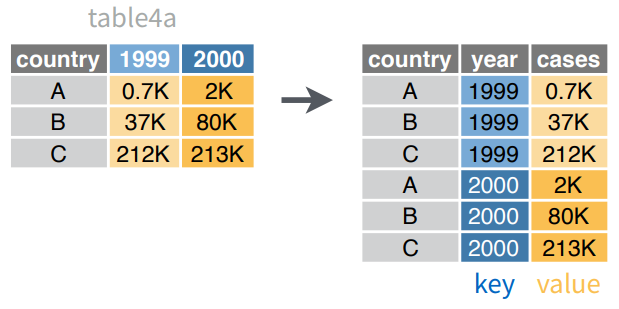
gather Código
## # A tibble: 6 x 3
##   country     year   cases
##   <chr>       <chr>  <int>
## 1 Afghanistan 1999     745
## 2 Brazil      1999   37737
## 3 China       1999  212258
## 4 Afghanistan 2000    2666
## 5 Brazil      2000   80488
## 6 China       2000  213766
spread Esparcir
Esparce un par de columnas (2, key-value) en multiples columnas

spread Ejemplo
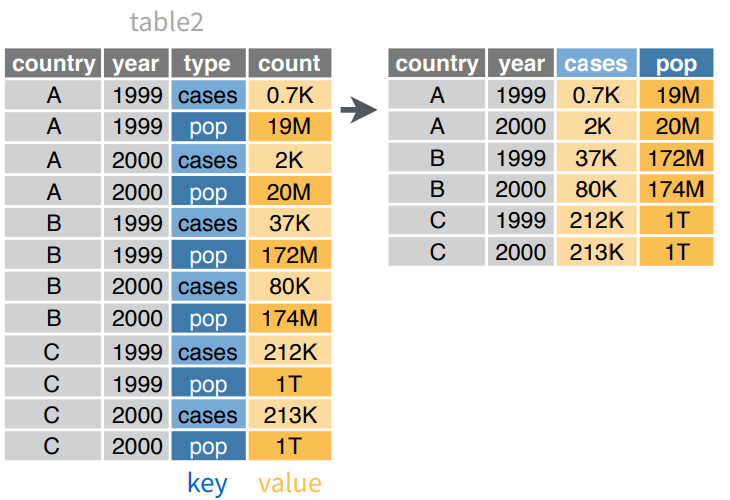
spread Código
## # A tibble: 6 x 4
##   country      year  cases population
##   <chr>       <int>  <int>      <int>
## 1 Afghanistan  1999    745   19987071
## 2 Afghanistan  2000   2666   20595360
## 3 Brazil       1999  37737  172006362
## 4 Brazil       2000  80488  174504898
## 5 China        1999 212258 1272915272
## 6 China        2000 213766 1280428583
Ejercicios
Revisemos el archivo 03-script-manipulacion-datos-02.R