library(tidyverse)
efficient_cars <- mtcars |>
as_tibble(rownames = "model") |>
mutate(
efficiency = mpg / wt,
transmission = if_else(am == 1, "manual", "automatic")
) |>
group_by(transmission, cyl) |>
summarise(mean_efficiency = mean(efficiency), .groups = "drop") |>
arrange(desc(mean_efficiency))
efficient_carsThis is the site’s native Quarto test post. It brings typography, metadata, code, widgets, figures and page columns together in one place.
One site, different rhythms
The landing page moves continuously. A post should do the opposite: give an idea enough room to unfold while preserving a recognizable visual language.
The title, description, date and categories above come directly from the YAML metadata, using Quarto’s native title block.
Some quicks points
- Titles in the main are with
##: Yes, the<h1>title is of the first/main title. - This is a link. Another link is https://github.com/quarto-dev/quarto-cli
Testing htmlwidgets
library(highcharter)
library(palmerpenguins)

hc <- hchart(
  penguins,
  "point",
  hcaes(bill_length_mm, bill_depth_mm, group = species)
  )

hc
Types of column
More info in https://quarto.org/docs/authoring/article-layout.html
How to use: In the chunk specify with column argument.
#| column: pageNow, list of main column types.
.column-body
.column-body-outset
.column-page
.column-page-inset
.column-screen
.column-screen-inset
.column-screen-inset-shaded
Figures
According to https://r4ds.hadley.nz/quarto.html#sec-figures:
library(ggplot2)
library(ggforce)

p <- ggplot(penguins, aes(x = flipper_length_mm, y = bill_length_mm)) +
  # geom_smooth(aes(color = species), method = "lm") +
  geom_mark_hull(
    aes(filter = species == "Gentoo", label = species),
    description = "A species with long flippers",
    color = "gray95",
    fill = "gray80",
    concavity = 4,
    label.fontsize = 8,
    description.fontsize = 7,
    label.family = ggplot2::theme_get()$text$family,
    description.family = ggplot2::theme_get()$text$family
  ) +
  geom_point(aes(fill = species), color = "gray80", size = 3, shape = 21) +
  scale_fill_viridis_d(option = "B", begin = 0.1, end = 0.9) +
  # scale_color_viridis_d(option = "B", begin = 0.1, end = 0.9) +
  labs(
    title = "Flipper and bill length",
    subtitle = "Dimensions for Adelie, Chinstrap and Gentoo Penguins at Palmer Station LTER",
    x = "Flipper length (mm)",
    y = "Bill length (mm)",
    fill = "Penguin species",
    caption = "Source: https://allisonhorst.github.io/palmerpenguins/"
  )

p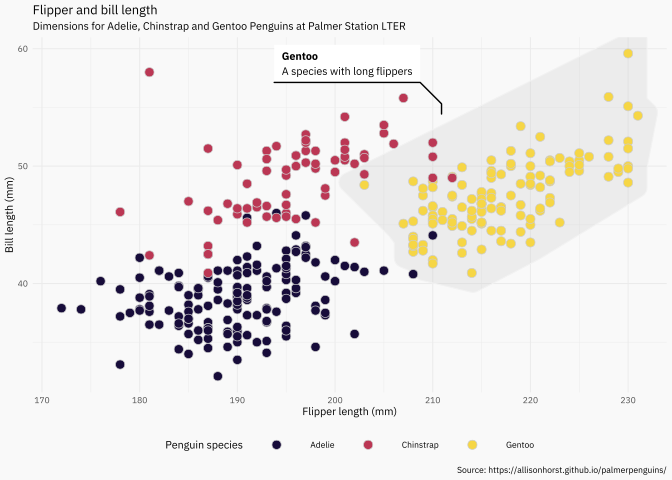
p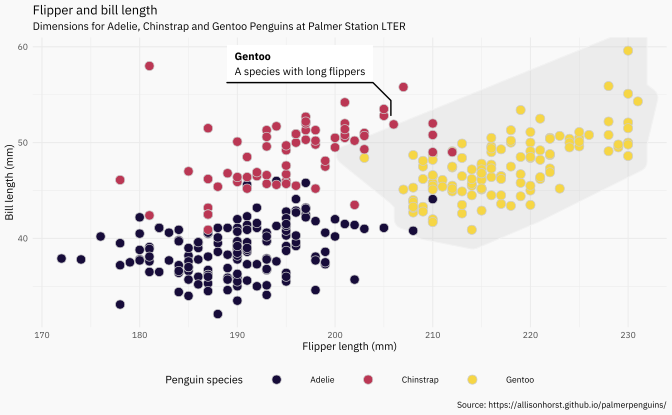
p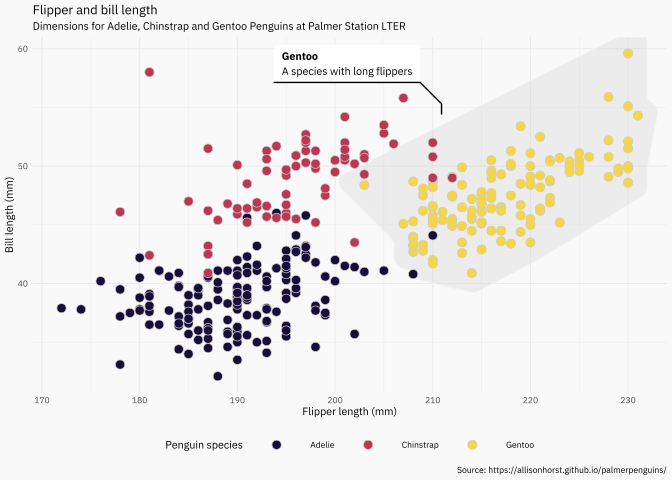
p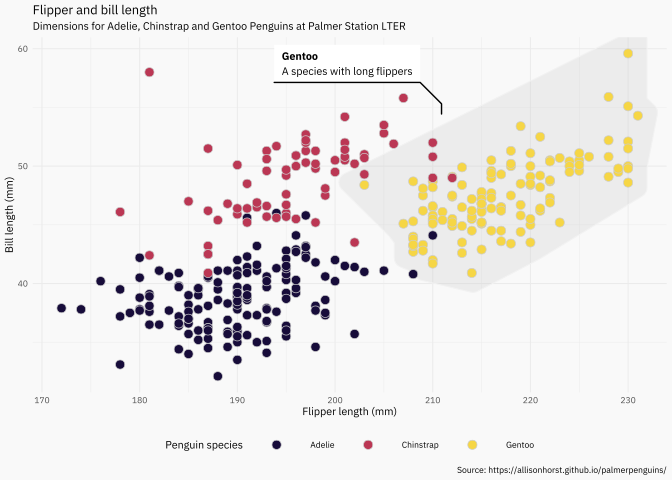
Computation without surprises
This final example tests a longer tidyverse pipeline and the site’s code presentation.
What this post tests
Together, these examples let us check native metadata, headings, links, code, HTML widgets, figures, wide layouts and margin content without maintaining two nearly identical test posts.