Pokémon: visualize ’em all! Again

Revisiting Pokémon similarity with UMAP, ggplot2 and Highcharter.
visualization
machine-learning
pokemon
highcharter
Author

Joshua Kunst

Published

August 14, 2026

A long time ago, when I was younger, I knew the original 150 Pokémon. Then the Pokédex kept growing: new generations, new types, new regions and a lot more monsters to remember.

In 2016 I downloaded the data and used it as an excuse to make charts and try a dimensionality-reduction method I had just discovered. The code got old, the links disappeared, but the question remained fun: what does the Pokémon universe look like when similarity becomes a map?

I have no idea

This version keeps the spirit of the original post, but uses the prepared data behind the Pokémon Dimensionality Reduction app, all nine generations, UMAP, and the current site setup.

Data

The prepared dataset joins the maintained PokeAPI tables: battle stats, morphology, capture and breeding traits, egg groups, species metadata, types, generation, and current sprite URLs. Keeping that preparation outside the post makes this article reproducible without downloading and joining many remote tables during every render.

Code
library(tidyverse)
library(highcharter)

pokemon_bundle <- readRDS("data/pokemon-data.rds")

pokemon <- pokemon_bundle$data |>
  filter(generation_id %in% 1:9) |>
  mutate(
    generation_label = factor(
      paste("Generation", generation_id),
      levels = paste("Generation", 1:9)
    ),
    pokemon_label = pokemon |>
      str_replace_all("-", " ") |>
      str_to_title(),
    type_2 = replace_na(type_2, "none")
  )

pokemon |>
  select(
    id, pokemon_label, generation_label, type_1, type_2,
    hp, attack, defense, special_attack, special_defense, speed
  ) |>
  slice_head(n = 6)
# A tibble: 6 × 11
     id pokemon_label generation_label type_1 type_2    hp attack defense
  <dbl> <chr>         <fct>            <chr>  <chr>  <dbl>  <dbl>   <dbl>
1     1 Bulbasaur     Generation 1     grass  poison    45     49      49
2     2 Ivysaur       Generation 1     grass  poison    60     62      63
3     3 Venusaur      Generation 1     grass  poison    80     82      83
4     4 Charmander    Generation 1     fire   none      39     52      43
5     5 Charmeleon    Generation 1     fire   none      58     64      58
6     6 Charizard     Generation 1     fire   flying    78     84      78
# ℹ 3 more variables: special_attack <dbl>, special_defense <dbl>, speed <dbl>

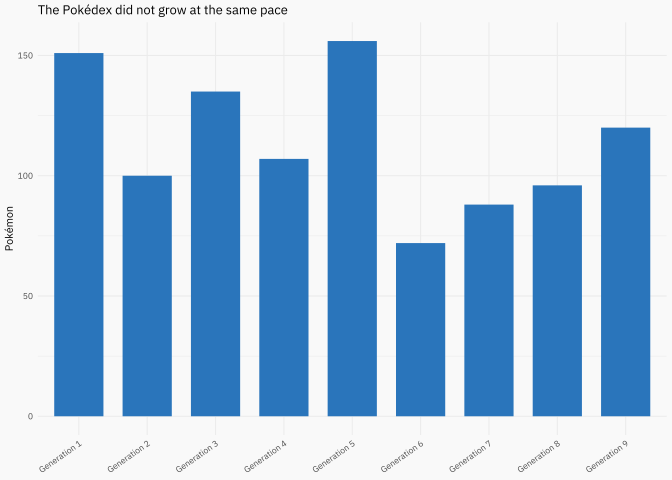
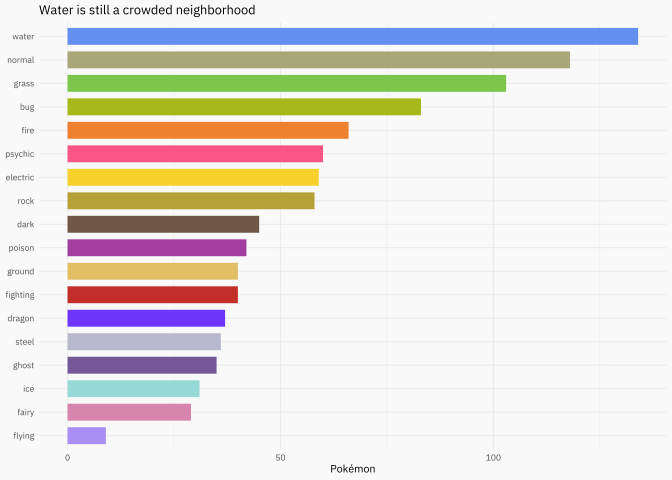
There are 1,025 Pokémon in the analysis. The nine generations are not equally large, and neither are the primary types.

Code
generation_counts <- pokemon |>
  count(generation_label)

type_counts <- pokemon |>
  count(type_1, type_color, sort = TRUE) |>
  mutate(type_1 = fct_reorder(type_1, n))

plot_generation_counts <- ggplot(
  generation_counts,
  aes(generation_label, n)
) +
  geom_col(fill = "#2A75BB", width = 0.72) +
  labs(
    title = "The Pokédex did not grow at the same pace",
    x = NULL,
    y = "Pokémon"
  ) +
  theme(axis.text.x = element_text(angle = 35, hjust = 1))

plot_type_counts <- ggplot(
  type_counts,
  aes(n, type_1, fill = type_color)
) +
  geom_col(width = 0.72, show.legend = FALSE) +
  scale_fill_identity() +
  labs(
    title = "Water is still a crowded neighborhood",
    x = "Pokémon",
    y = NULL
  )

plot_generation_counts

Code
plot_type_counts

What makes two Pokémon similar?

The app allows several recipes and explicit weights. Here I want one simpler experiment. Continuous variables are median-imputed and standardized; binary variables remain 0/1; egg groups and species traits are one-hot encoded. Every resulting column enters without additional block weighting.

Two variables are deliberately absent:

  • type does not enter the UMAP. It will color and facet the result, allowing us to see whether type-related structure appears from the other traits;
  • generation is also excluded. It is a control used to inspect whether some generations occupy more distinctive parts of the same space.

That distinction matters. If type helped construct the coordinates, finding clusters by type afterward would not be much of a discovery.

Code
scale_continuous <- function(data) {
  data <- as.data.frame(data)

  data[] <- lapply(data, function(variable) {
    variable <- as.numeric(variable)
    replacement <- median(variable, na.rm = TRUE)
    if (!is.finite(replacement)) replacement <- 0
    variable[is.na(variable)] <- replacement
    variable
  })

  values <- as.matrix(data)
  centers <- colMeans(values)
  spreads <- apply(values, 2, sd)
  spreads[!is.finite(spreads) | spreads == 0] <- 1

  values <- sweep(values, 2, centers, FUN = "-")
  sweep(values, 2, spreads, FUN = "/")
}

feature_data <- pokemon |>
  mutate(
    female_ratio = if_else(gender_rate < 0, NA_real_, gender_rate / 8),
    genderless = as.numeric(gender_rate < 0)
  )

continuous_features <- feature_data |>
  select(
    height, weight, base_experience,
    hp, attack, defense, special_attack, special_defense, speed,
    capture_rate, base_happiness, hatch_counter, female_ratio
  ) |>
  scale_continuous()

binary_features <- feature_data |>
  transmute(
    is_baby = as.numeric(replace_na(is_baby, 0)),
    is_legendary = as.numeric(replace_na(is_legendary, 0)),
    is_mythical = as.numeric(replace_na(is_mythical, 0)),
    has_gender_differences = as.numeric(
      replace_na(has_gender_differences, 0)
    ),
    forms_switchable = as.numeric(replace_na(forms_switchable, 0)),
    genderless = as.numeric(replace_na(genderless, 0))
  ) |>
  as.matrix()

egg_group_data <- feature_data |>
  transmute(
    egg_group_1 = factor(replace_na(egg_group_1, "none")),
    egg_group_2 = factor(replace_na(egg_group_2, "none"))
  )

egg_group_features <- model.matrix(
  ~ egg_group_1 + egg_group_2 - 1,
  data = egg_group_data
)

species_trait_data <- feature_data |>
  transmute(
    growth_rate = factor(replace_na(growth_rate, "unknown")),
    body_color = factor(replace_na(body_color, "unknown")),
    body_shape = factor(replace_na(body_shape, "unknown")),
    habitat = factor(replace_na(habitat, "unknown"))
  )

species_trait_features <- model.matrix(
  ~ growth_rate + body_color + body_shape + habitat - 1,
  data = species_trait_data
)

features <- cbind(
  continuous_features,
  binary_features,
  egg_group_features,
  species_trait_features
)

dim(features)
[1] 1025   83

A Wild UMAP Appears!

UMAP places nearby profiles close together in two dimensions. Its axes do not have a direct interpretation and its geometry should not be read as a precise measurement. The useful part is the neighborhood structure: who remains near whom, and which visual patterns survive the projection?

Code
set.seed(13242)

umap_coordinates <- uwot::umap(
  features,
  n_neighbors = 30,
  min_dist = 0.15,
  metric = "euclidean",
  n_components = 2,
  n_threads = 1,
  verbose = FALSE
)

pokemon <- pokemon |>
  mutate(
    umap_1 = umap_coordinates[, 1],
    umap_2 = umap_coordinates[, 2]
  )

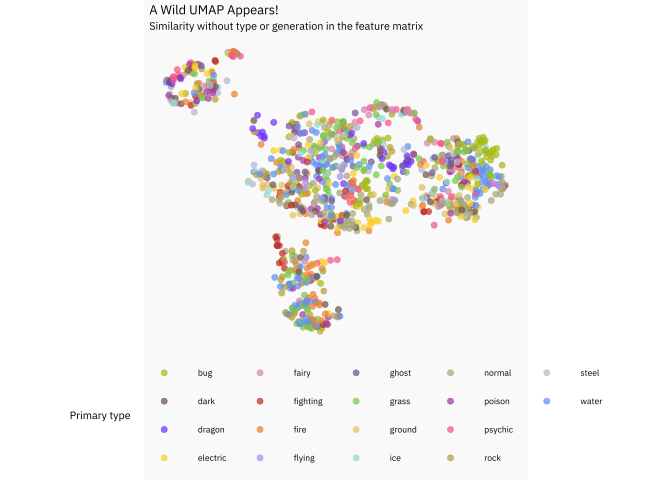
First, the complete map. Type is now only a color: it did not participate in the UMAP calculation.

Code
type_palette <- pokemon |>
  distinct(type_1, type_color) |>
  deframe()

ggplot(pokemon, aes(umap_1, umap_2, color = type_1)) +
  geom_point(size = 1.9, alpha = 0.72) +
  scale_color_manual(values = type_palette) +
  coord_equal() +
  labs(
    title = "A Wild UMAP Appears!",
    subtitle = "Similarity without type or generation in the feature matrix",
    color = "Primary type",
    x = NULL,
    y = NULL
  ) +
  theme(
    axis.text = element_blank(),
    axis.ticks = element_blank(),
    panel.grid = element_blank()
  )

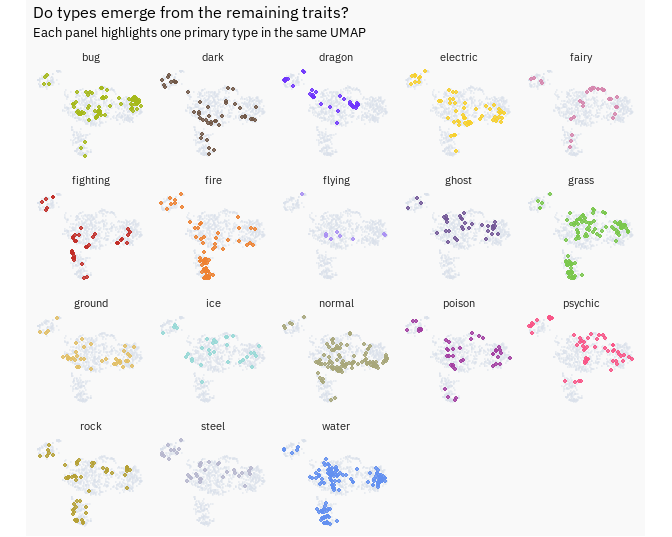
The colors are not perfectly separated—and they should not be. Still, some types occupy more compact neighborhoods while others spread across the map. That is evidence of association between type and the traits used here, not a claim that type is completely determined by them.

Looking through type

A faceted view makes every type visible without losing the global geometry. All Pokémon remain in the background; the selected type is highlighted in its own panel.

Code
# Dense repeated point fields are rasterized to keep the page lightweight.
type_levels <- sort(unique(pokemon$type_1))

type_background <- tidyr::crossing(
  control_type = type_levels,
  pokemon |>
    select(umap_1, umap_2)
)

type_foreground <- pokemon |>
  mutate(control_type = type_1)

ggplot() +
  geom_point(
    data = type_background,
    aes(umap_1, umap_2),
    color = "#D9E0EA",
    size = 0.35,
    alpha = 0.32
  ) +
  geom_point(
    data = type_foreground,
    aes(umap_1, umap_2, color = type_1),
    size = 1.15,
    alpha = 0.82,
    show.legend = FALSE
  ) +
  scale_color_manual(values = type_palette) +
  facet_wrap(vars(control_type), ncol = 5) +
  coord_equal() +
  labs(
    title = "Do types emerge from the remaining traits?",
    subtitle = "Each panel highlights one primary type in the same UMAP",
    x = NULL,
    y = NULL
  ) +
  theme_minimal(base_size = 10, base_family = plot_font_family) +
  theme(
    plot.background = element_rect(fill = "#f9f9f9", colour = NA),
    panel.background = element_rect(fill = "#f9f9f9", colour = NA),
    axis.text = element_blank(),
    axis.ticks = element_blank(),
    panel.grid = element_blank(),
    panel.spacing = grid::unit(0.45, "lines")
  )

Looking through generation

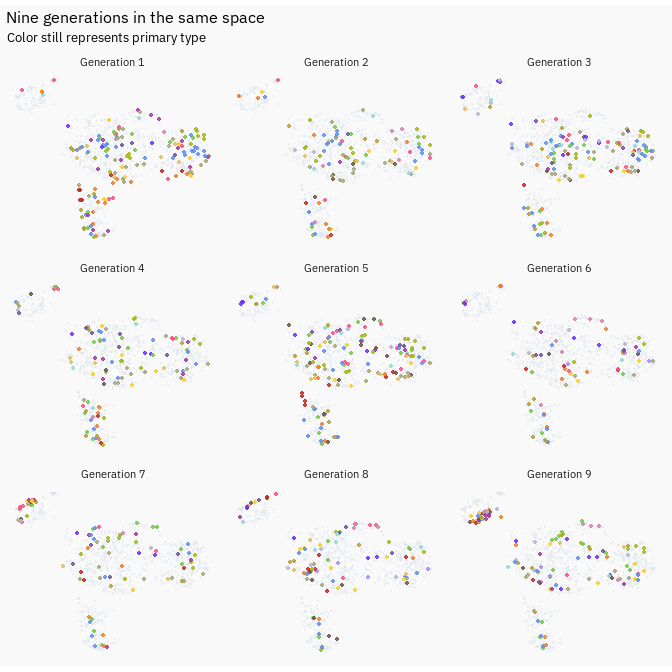
Generation is another control. Because every panel uses the same coordinates, we can see whether a generation fills the existing space or introduces Pokémon in more particular regions.

Code
# Dense repeated point fields are rasterized to keep the page lightweight.
generation_levels <- levels(pokemon$generation_label)

generation_background <- tidyr::crossing(
  control_generation = generation_levels,
  pokemon |>
    select(umap_1, umap_2)
)

generation_foreground <- pokemon |>
  mutate(control_generation = generation_label)

ggplot() +
  geom_point(
    data = generation_background,
    aes(umap_1, umap_2),
    color = "#D9E0EA",
    size = 0.42,
    alpha = 0.30
  ) +
  geom_point(
    data = generation_foreground,
    aes(umap_1, umap_2, color = type_1),
    size = 1.25,
    alpha = 0.85,
    show.legend = FALSE
  ) +
  scale_color_manual(values = type_palette) +
  facet_wrap(vars(control_generation), ncol = 3) +
  coord_equal() +
  labs(
    title = "Nine generations in the same space",
    subtitle = "Color still represents primary type",
    x = NULL,
    y = NULL
  ) +
  theme_minimal(base_size = 10, base_family = plot_font_family) +
  theme(
    plot.background = element_rect(fill = "#f9f9f9", colour = NA),
    panel.background = element_rect(fill = "#f9f9f9", colour = NA),
    axis.text = element_blank(),
    axis.ticks = element_blank(),
    panel.grid = element_blank(),
    panel.spacing = grid::unit(0.55, "lines")
  )

The panels help distinguish two ideas that are easy to mix up: a generation can add many Pokémon without creating a completely new region, while a smaller generation can still contribute unusual profiles.

Explore ’em all

Points are useful for analysis. Sprites are better for exploration. The final chart uses exactly the same UMAP coordinates, so changing the visual mark does not change the result.

Show chart code
point_data <- pokemon |>
  transmute(
    x = umap_1,
    y = umap_2,
    pokemon = pokemon_label,
    generation = as.character(generation_label),
    type_1 = str_to_title(type_1),
    type_2 = if_else(type_2 == "none", "—", str_to_title(type_2)),
    type_color,
    height_m = round(height / 10, 1),
    weight_kg = round(weight / 10, 1),
    hp,
    attack,
    defense,
    special_attack,
    special_defense,
    speed,
    capture_rate,
    artwork_url,
    sprite_url
  ) |>
  purrr::pmap(function(
    x, y, pokemon, generation, type_1, type_2, type_color,
    height_m, weight_kg, hp, attack, defense,
    special_attack, special_defense, speed, capture_rate,
    artwork_url, sprite_url
  ) {
    list(
      x = x,
      y = y,
      name = pokemon,
      pokemon = pokemon,
      generation = generation,
      type_1 = type_1,
      type_2 = type_2,
      type_color = type_color,
      height_m = height_m,
      weight_kg = weight_kg,
      hp = hp,
      attack = attack,
      defense = defense,
      special_attack = special_attack,
      special_defense = special_defense,
      speed = speed,
      capture_rate = capture_rate,
      artwork_url = artwork_url,
      marker = list(
        symbol = sprintf("url(%s)", sprite_url),
        width = 28,
        height = 28
      )
    )
  }) |>
  unname()

halo_data <- pokemon |>
  transmute(
    x = umap_1,
    y = umap_2,
    color = scales::alpha(type_color, 0.18)
  ) |>
  purrr::pmap(function(x, y, color) {
    list(
      x = x,
      y = y,
      color = color,
      marker = list(symbol = "circle", radius = 18)
    )
  }) |>
  unname()

point_data_by_type <- split(point_data, pokemon$type_1)
halo_data_by_type <- split(halo_data, pokemon$type_1)

legend_type_focus <- htmlwidgets::JS(
  "function () {
    var chart = this;

    function setFocus(typeKey) {
      chart.series.forEach(function (series) {
        var custom = series.options.custom || {};
        var sameType = custom.typeKey === typeKey;
        var opacity = custom.isHalo ? (sameType ? 1 : 0) :
          (sameType ? 1 : 0.12);
        var group = series.markerGroup || series.group;

        if (group) {
          group.attr({ opacity: opacity });
          if (sameType) group.toFront();
        }
      });
    }

    function resetFocus() {
      chart.series.forEach(function (series) {
        var custom = series.options.custom || {};
        var group = series.markerGroup || series.group;
        if (group) group.attr({ opacity: custom.isHalo ? 0 : 1 });
      });
    }

    chart.series.forEach(function (series) {
      if (!series.options.showInLegend) return;
      var legendGroup = series.legendItem && series.legendItem.group
        ? series.legendItem.group
        : series.legendGroup;
      var element = legendGroup && legendGroup.element;
      if (!element || element.__pokemonTypeFocusBound) return;

      element.__pokemonTypeFocusBound = true;
      element.addEventListener('mouseenter', function () {
        setFocus(series.options.custom.typeKey);
      });
      element.addEventListener('mouseleave', resetFocus);
    });
  }"
)

raise_tooltip <- htmlwidgets::JS(
  "function () {
    var chart = this.series.chart;
    window.setTimeout(function () {
      if (chart.tooltip && chart.tooltip.label) {
        chart.tooltip.label.toFront();
      }
      if (chart.tooltip && chart.tooltip.container) {
        chart.tooltip.container.style.zIndex = 99999;
      }
    }, 0);
  }"
)

pokemon_series <- sort(names(point_data_by_type)) |>
  purrr::map(function(type_key) {
    type_name <- stringr::str_to_title(type_key)
    type_color <- unname(type_palette[[type_key]])
    sprite_id <- paste0("type-", type_key)

    list(
      list(
        data = halo_data_by_type[[type_key]],
        name = paste(type_name, "halo"),
        linkedTo = sprite_id,
        turboThreshold = 0,
        showInLegend = FALSE,
        enableMouseTracking = FALSE,
        opacity = 0,
        states = list(
          inactive = list(opacity = 0),
          hover = list(opacity = 0)
        ),
        custom = list(typeKey = type_key, isHalo = TRUE),
        zIndex = 1
      ),
      list(
        data = point_data_by_type[[type_key]],
        id = sprite_id,
        name = type_name,
        color = type_color,
        marker = list(symbol = "circle", radius = 5),
        turboThreshold = 0,
        showInLegend = TRUE,
        custom = list(typeKey = type_key, isHalo = FALSE),
        zIndex = 2
      )
    )
  }) |>
  purrr::list_flatten()

tooltip <- paste0(
  '<div style="width:270px;padding:12px;font-family:inherit;background-color:rgb(244,246,248)!important;color:#17324d;border-radius:12px;box-shadow:0 8px 24px rgba(23,50,77,.16);opacity:1!important">',
  '<div style="display:flex;gap:12px;align-items:center">',
  '<img src="{point.artwork_url}" style="width:92px;height:92px;object-fit:contain">',
  '<div><div style="font-size:18px;font-weight:600">{point.pokemon}</div>',
  '<div style="font-size:11px;opacity:.65">{point.generation}</div>',
  '<div style="margin-top:5px">',
  '<span style="background:{point.type_color};color:white;padding:2px 7px;border-radius:10px">{point.type_1}</span>',
  '<span style="margin-left:5px">{point.type_2}</span></div>',
  '<div style="margin-top:8px">{point.height_m} m · {point.weight_kg} kg</div>',
  '</div></div>',
  '<table style="width:100%;margin-top:10px;font-size:12px;background-color:rgb(244,246,248)!important;opacity:1!important">',
  '<tr><td>HP</td><td><b>{point.hp}</b></td><td>Attack</td><td><b>{point.attack}</b></td></tr>',
  '<tr><td>Defense</td><td><b>{point.defense}</b></td><td>Speed</td><td><b>{point.speed}</b></td></tr>',
  '<tr><td>Sp. Atk</td><td><b>{point.special_attack}</b></td><td>Sp. Def</td><td><b>{point.special_defense}</b></td></tr>',
  '<tr><td>Capture</td><td colspan="3"><b>{point.capture_rate}</b></td></tr>',
  '</table></div>'
)

pokemon_chart <- highchart() |>
  hc_chart(
    type = "scatter",
    zoomType = "xy",
    panning = list(enabled = TRUE, type = "xy"),
    panKey = "shift",
    backgroundColor = "transparent",
    animation = FALSE,
    events = list(load = legend_type_focus)
  ) |>
  hc_title(text = "A Wild UMAP Appears!") |>
  hc_subtitle(
    text = "Stats, morphology, breeding and species traits · type and generation excluded"
  ) |>
  hc_xAxis(visible = FALSE) |>
  hc_yAxis(visible = FALSE) |>
  hc_add_series_list(pokemon_series) |>
  hc_legend(
    enabled = TRUE,
    align = "center",
    verticalAlign = "top",
    layout = "horizontal",
    symbolRadius = 5,
    itemStyle = list(fontWeight = 400)
  ) |>
  hc_tooltip(
    useHTML = TRUE,
    outside = TRUE,
    backgroundColor = "rgb(244, 246, 248)",
    style = list(color = "#17324d", opacity = 1),
    borderWidth = 0,
    borderRadius = 12,
    shadow = TRUE,
    padding = 0,
    headerFormat = "",
    pointFormat = tooltip
  ) |>
  hc_plotOptions(
    series = list(
      animation = FALSE,
      point = list(
        events = list(mouseOver = raise_tooltip)
      ),
      states = list(
        inactive = list(opacity = 1),
        hover = list(halo = list(size = 34, opacity = 0.25))
      )
    )
  ) |>
  hc_credits(enabled = FALSE) |> 
  hc_size(height = 900)

Code
pokemon_chart

Zooming into the chart brings back the pleasure of the original post: evolution families, extreme stats, strange combinations, and unexpected neighbors are more interesting than any single global summary.

Keep exploring

This post intentionally fixes one question and one UMAP. The full application lets you compare PCA, t-SNE, and UMAP, change generations, and explore different definitions of similarity. It is part of Visual Data Lab, my collection of small applications and visualization experiments. You can use the embedded version below or open the Pokémon explorer in a new tab.

The original conclusion was basically: nice algorithm to keep testing with other data. I still agree :B.

Happy Haunter

Sources