Explore Chilean census data through interactive visualizations and territorial comparisons.
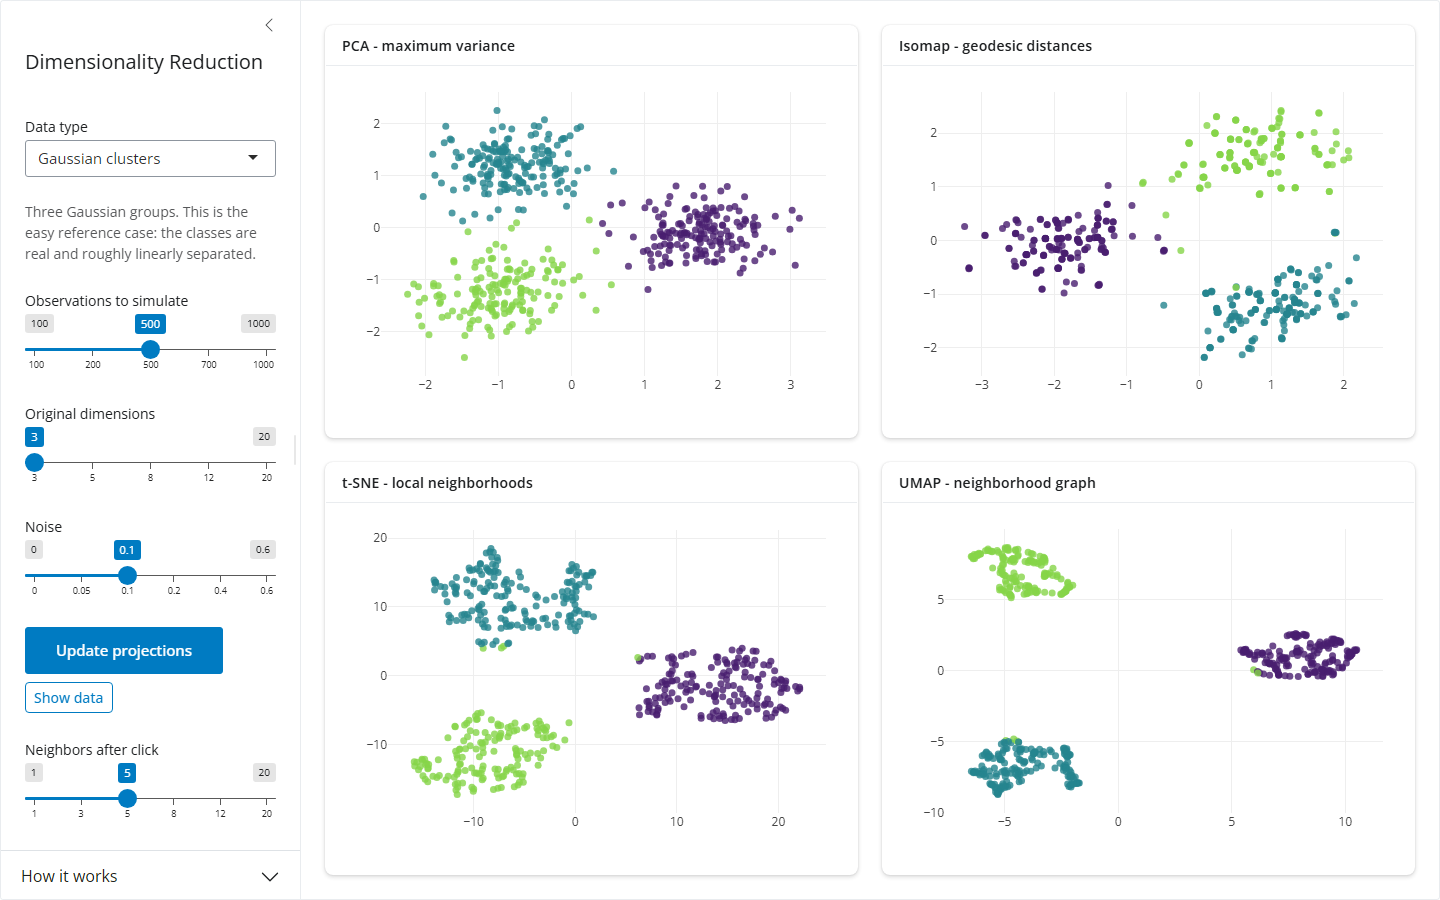
Interactive experiments that explore data, statistics and machine learning through visualization.
Visual explanations of data methods and algorithms, explored step by step.
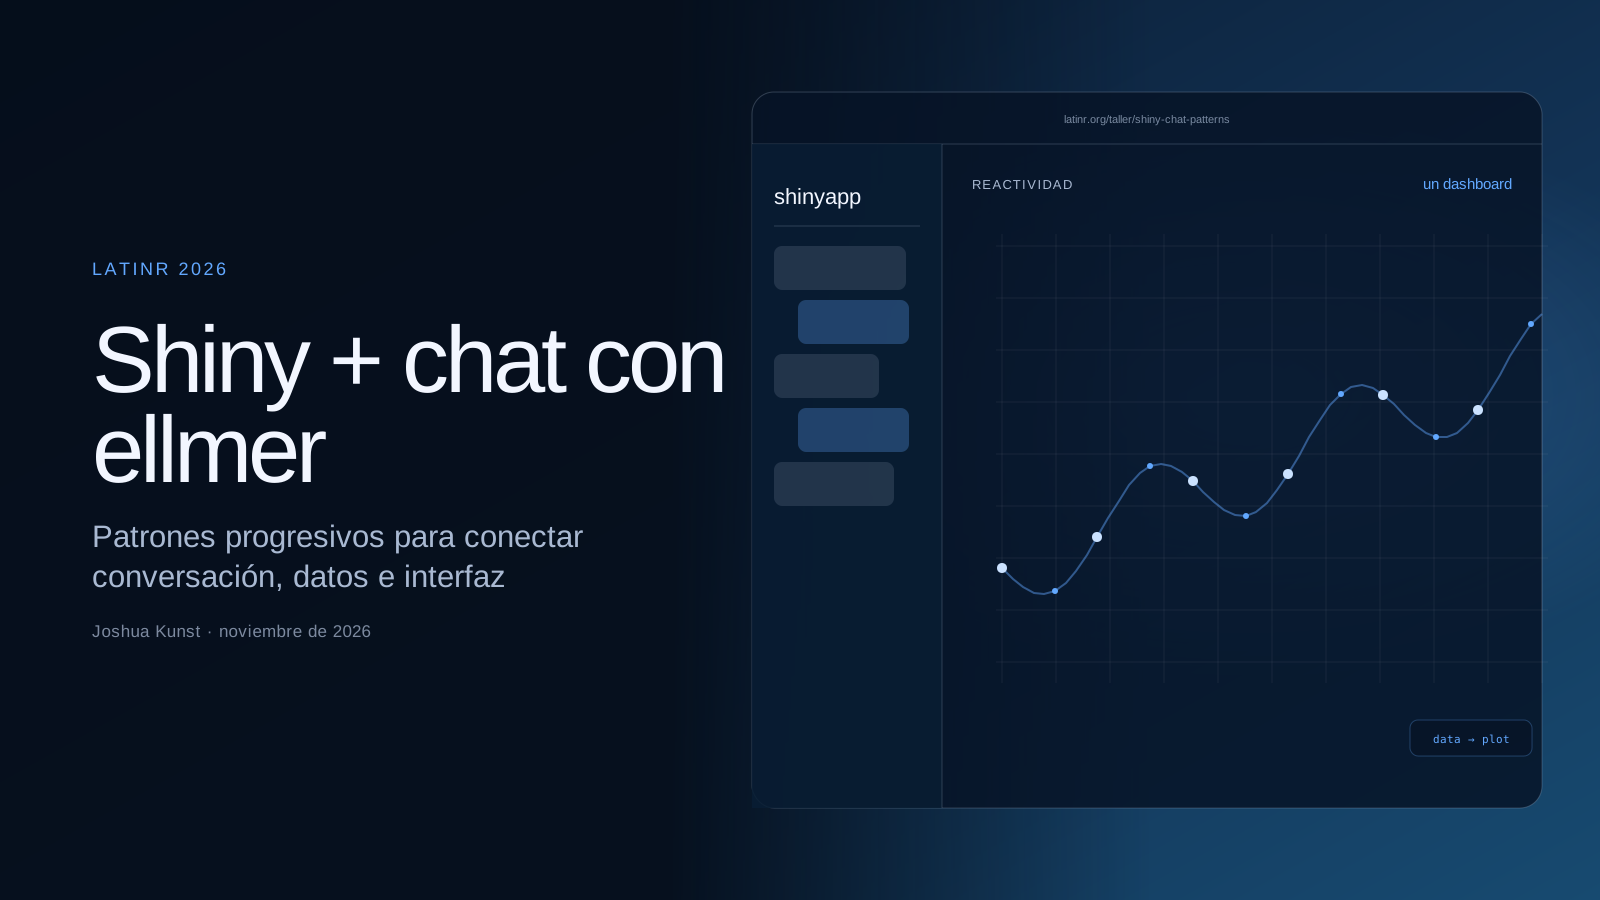
Progressive R and Python examples for adding chat, tools and interface actions to Shiny applications.
An interface to Highcharts for interactive charts, maps, stock charts and custom visualizations.
A lightweight Shiny input for draggable probability distributions that behave like regular reactive inputs.
A lightweight VS Code-inspired navigation shell for bslib applications.
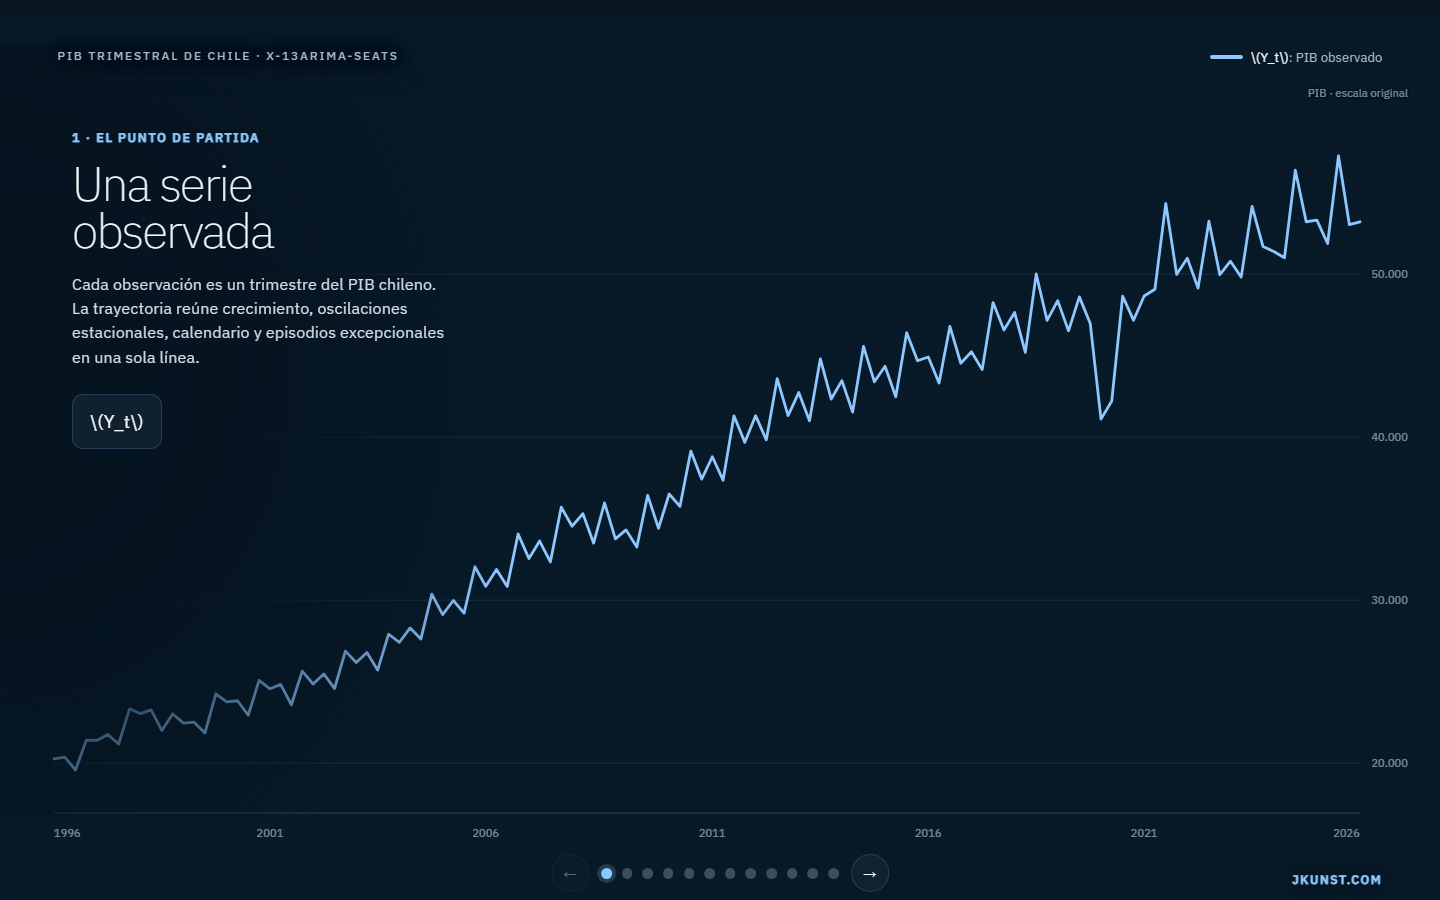
Access statistical series from the Central Bank of Chile.
Credit-risk modelling helpers that complement scorecard development workflows.
Tools for permutation importance and feature selection.
Simulated data sets for teaching statistics and machine learning.
Chess logic, move validation and board visualization.