Plot woes
Examples
data("woes")
woes <- head(woes)
pps <- gg_woes(woes)
#> id_client (IV = 0.42%)
#> sex (IV = 2.60%)
#> marital_status (IV = 9.60%)
#> age (IV = 19.40%)
#> flag_res_phone (IV = 7.54%)
#> area_code_res_phone (IV = 4.17%)
if(require(patchwork)){
purrr::reduce(pps, `+`) &
ggplot2::theme(
axis.text.x = ggplot2::element_text(size = 7),
axis.text.y = ggplot2::element_text(size = 7)
)
}
#> Loading required package: patchwork
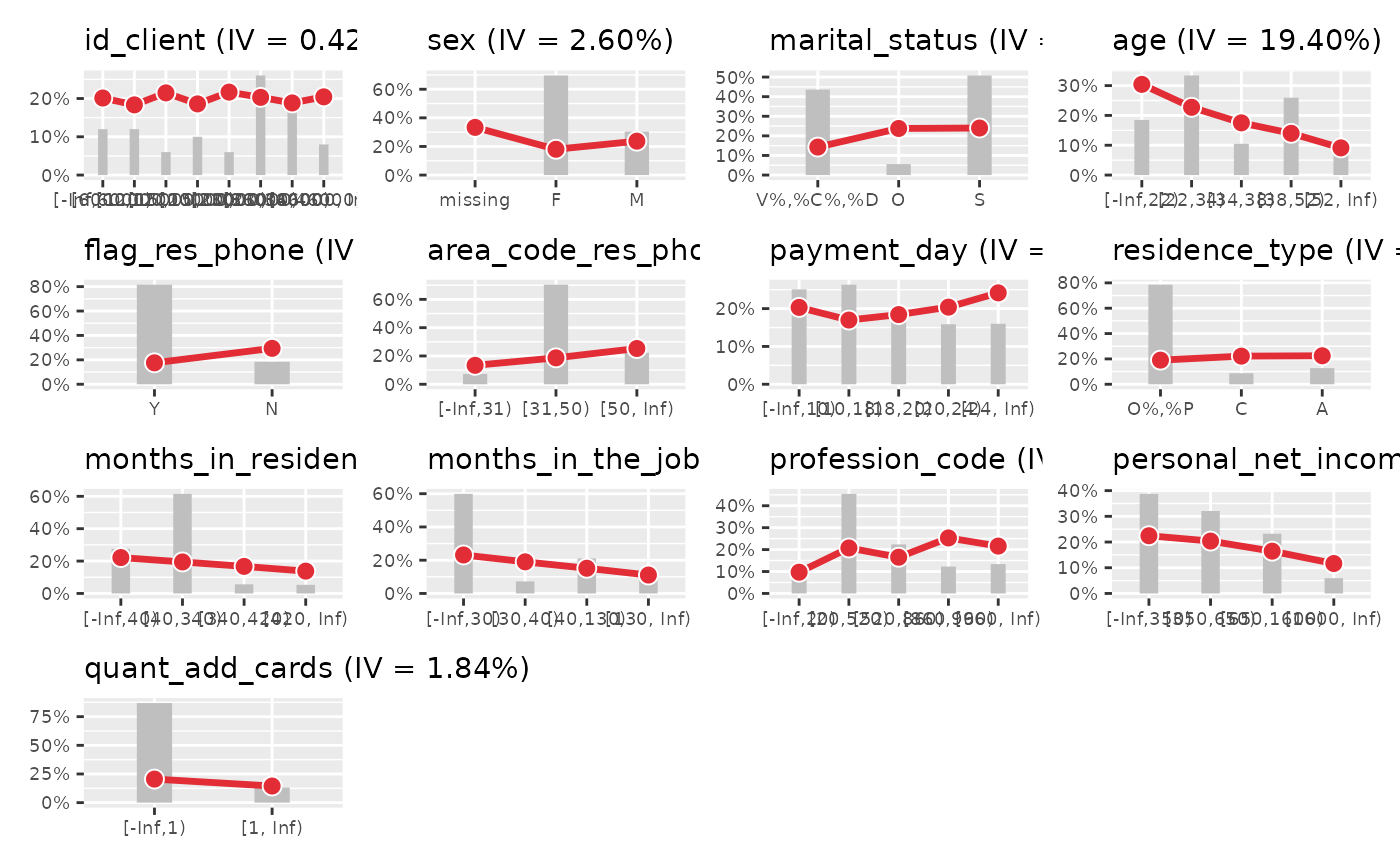 gg_woes(woes, variable = "woe")
#> id_client (IV = 0.42%)
#> sex (IV = 2.60%)
#> marital_status (IV = 9.60%)
#> age (IV = 19.40%)
#> flag_res_phone (IV = 7.54%)
#> area_code_res_phone (IV = 4.17%)
#> $id_client
gg_woes(woes, variable = "woe")
#> id_client (IV = 0.42%)
#> sex (IV = 2.60%)
#> marital_status (IV = 9.60%)
#> age (IV = 19.40%)
#> flag_res_phone (IV = 7.54%)
#> area_code_res_phone (IV = 4.17%)
#> $id_client
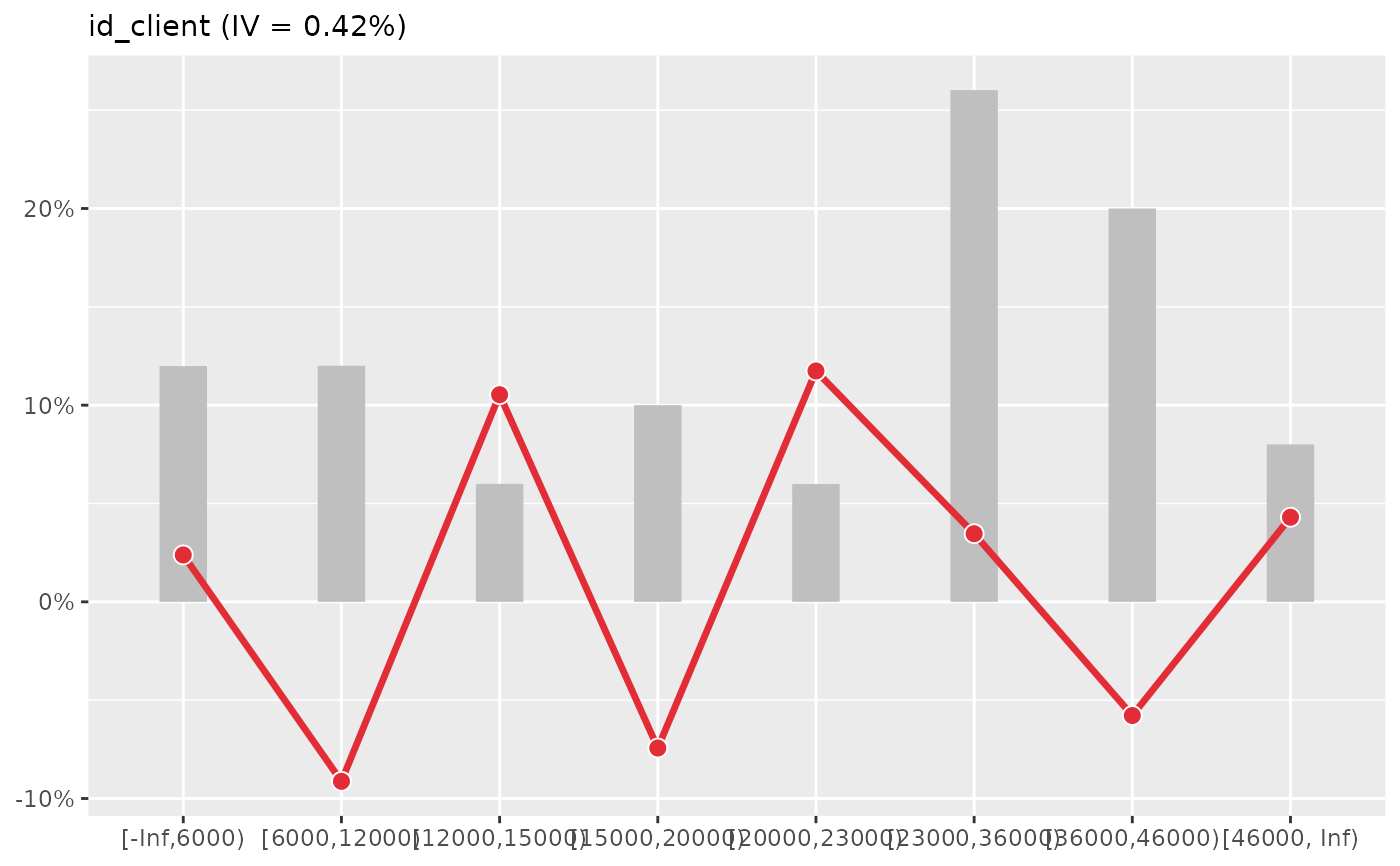 #>
#> $sex
#>
#> $sex
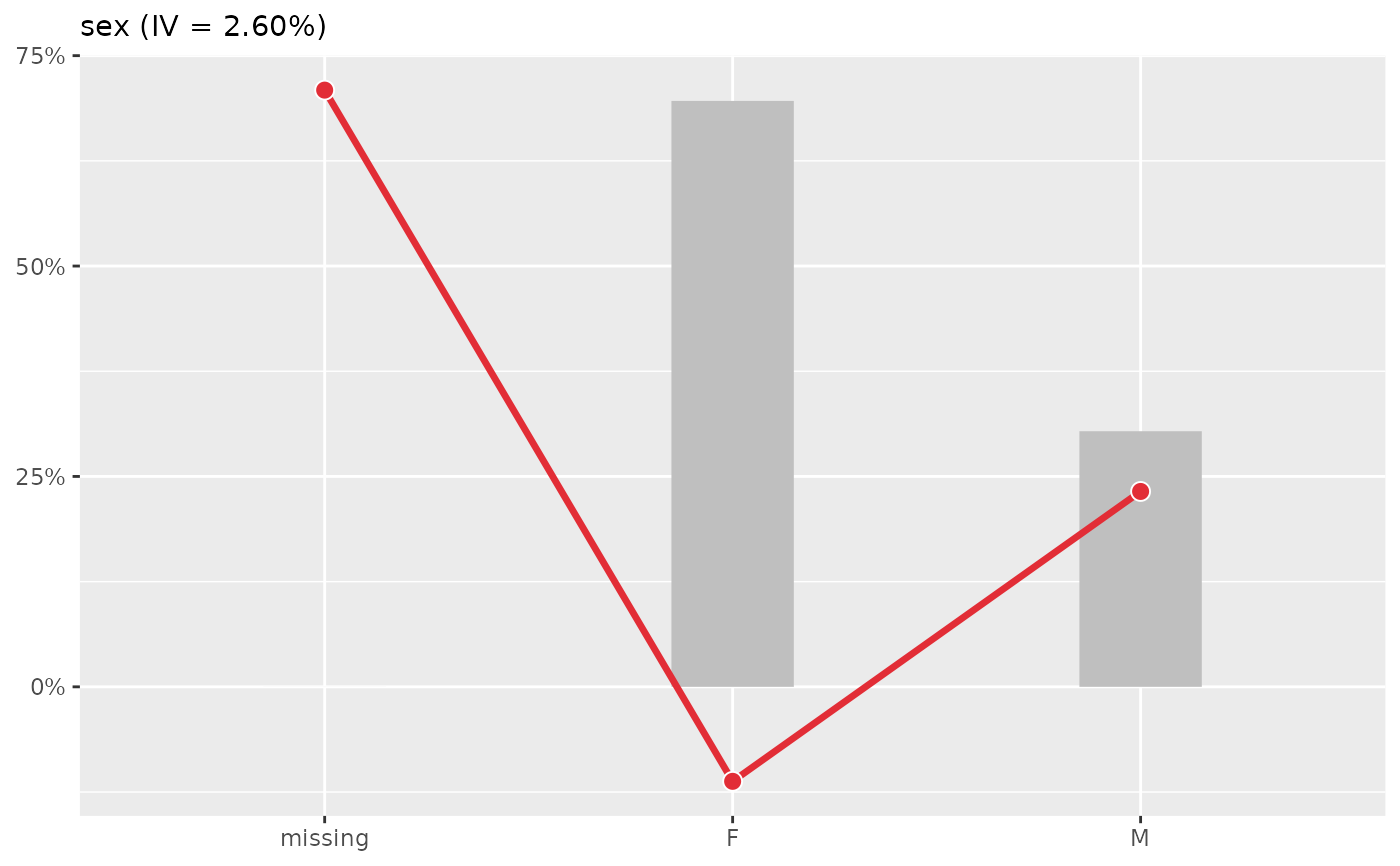 #>
#> $marital_status
#>
#> $marital_status
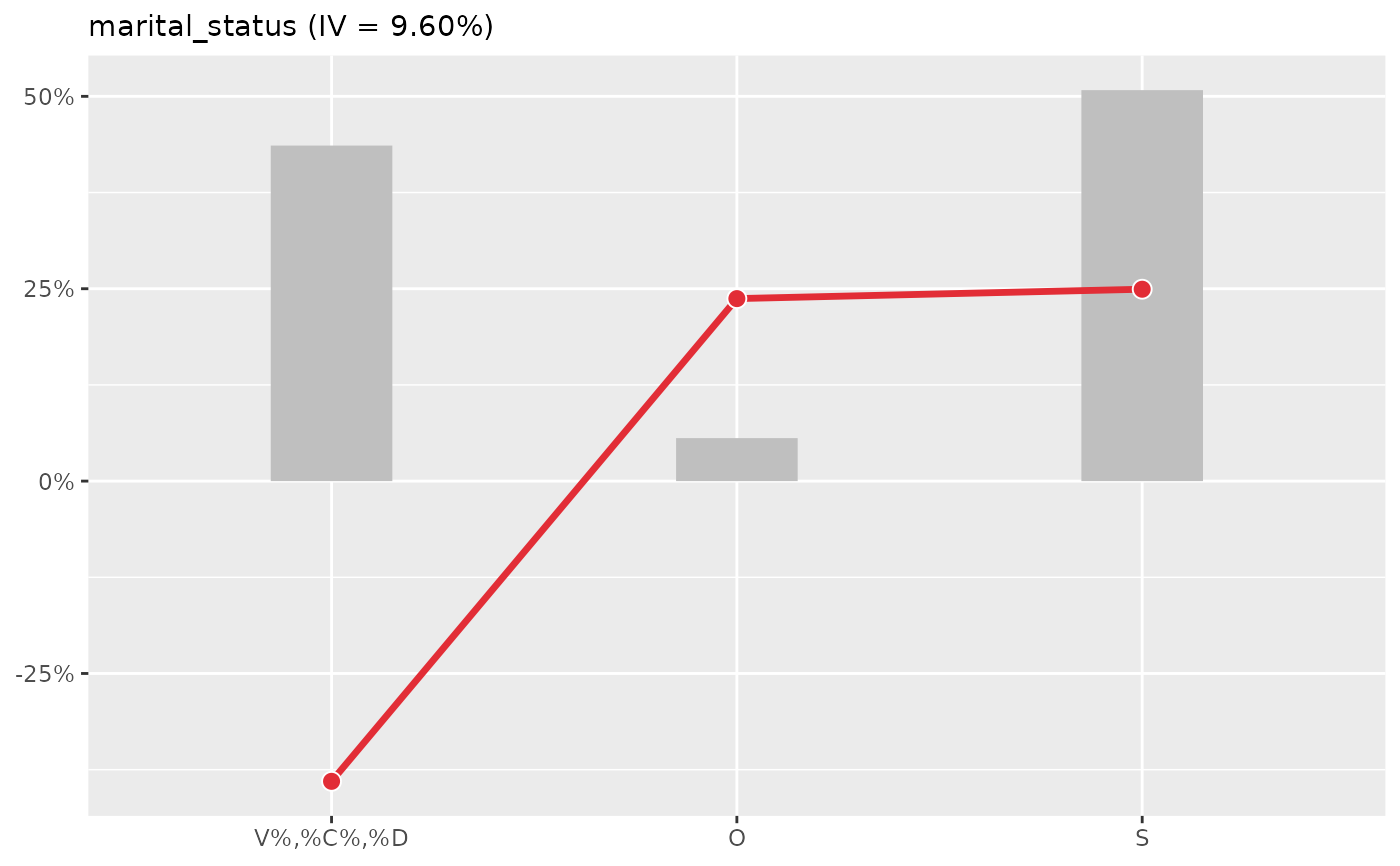 #>
#> $age
#>
#> $age
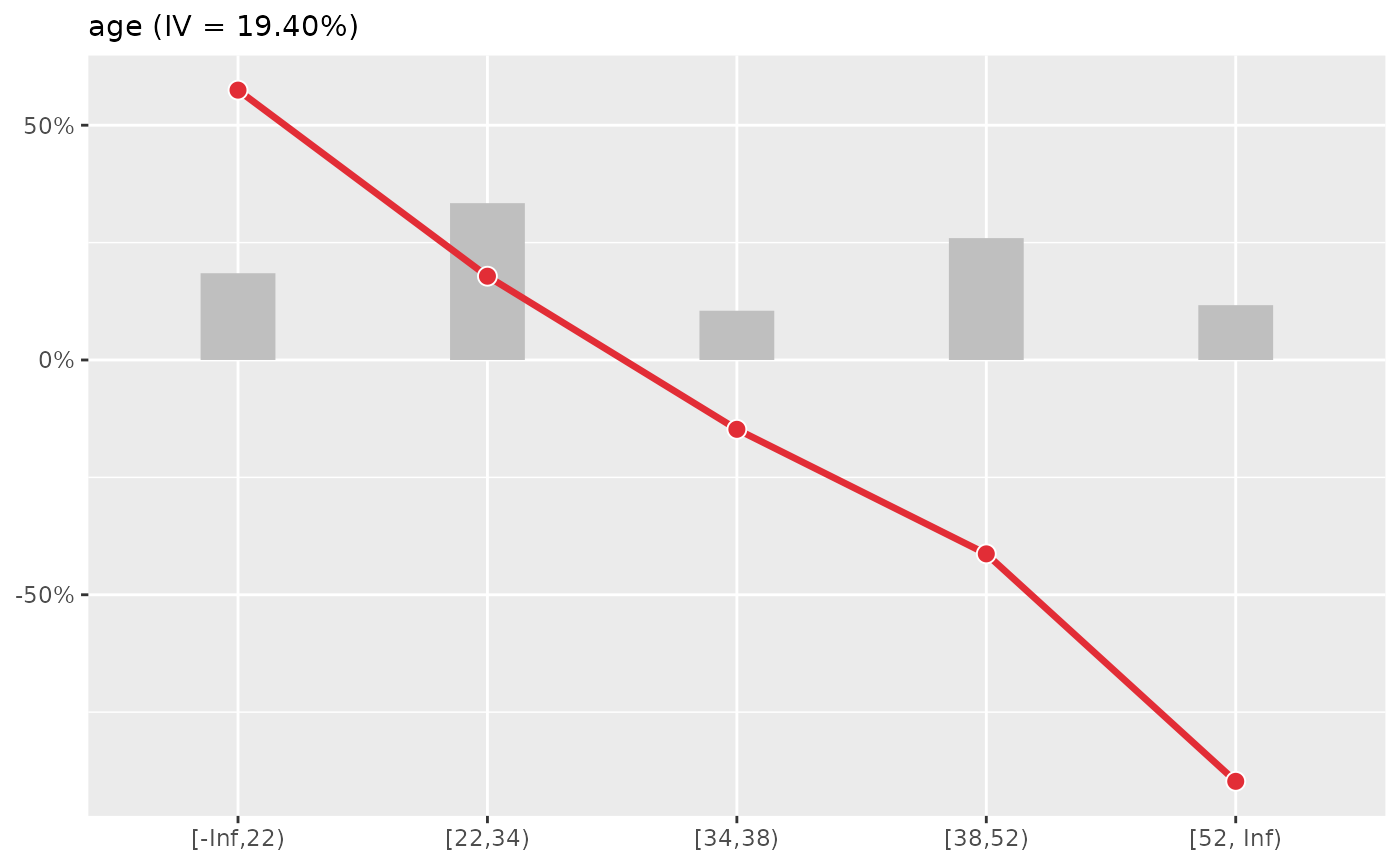 #>
#> $flag_res_phone
#>
#> $flag_res_phone
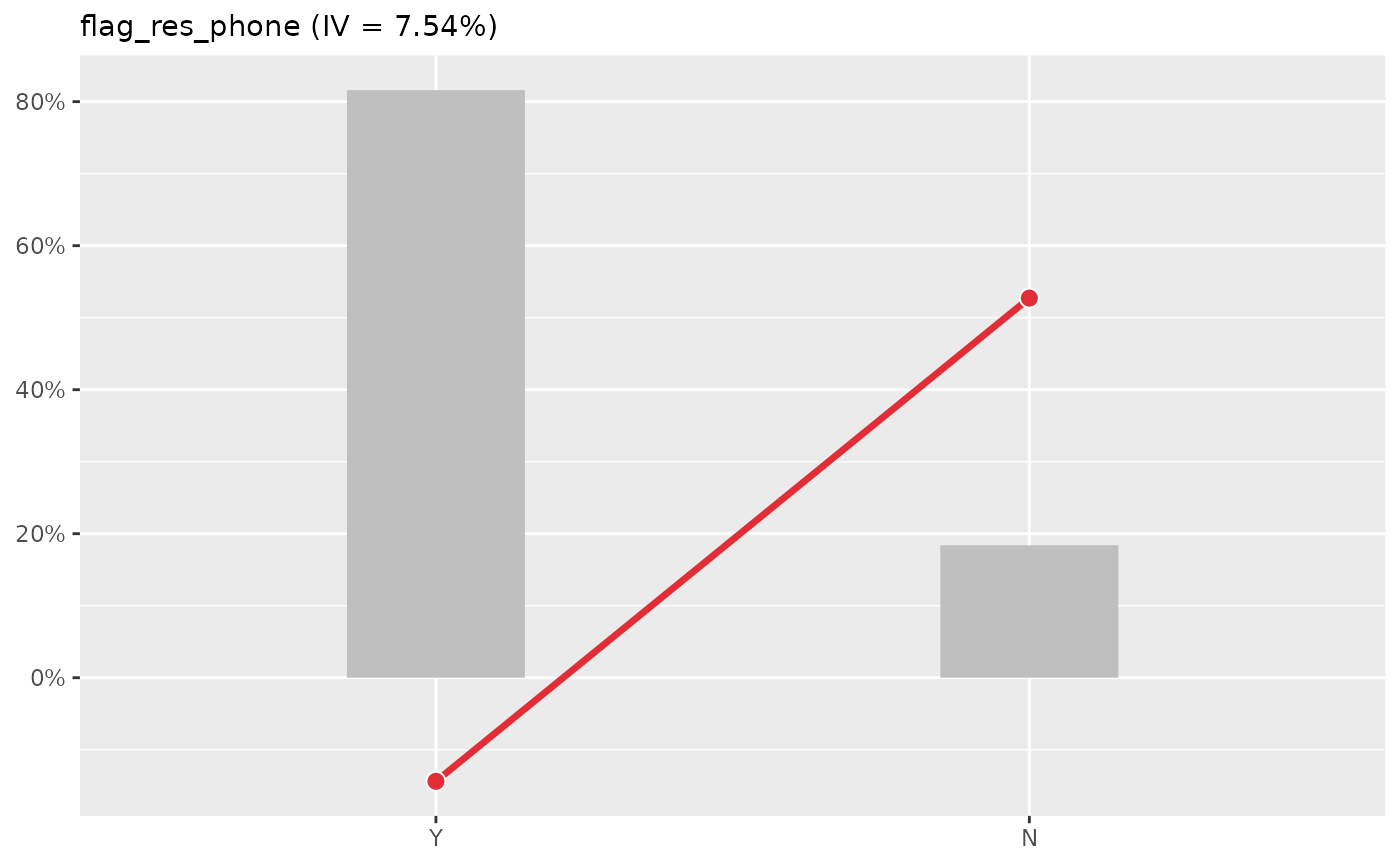 #>
#> $area_code_res_phone
#>
#> $area_code_res_phone
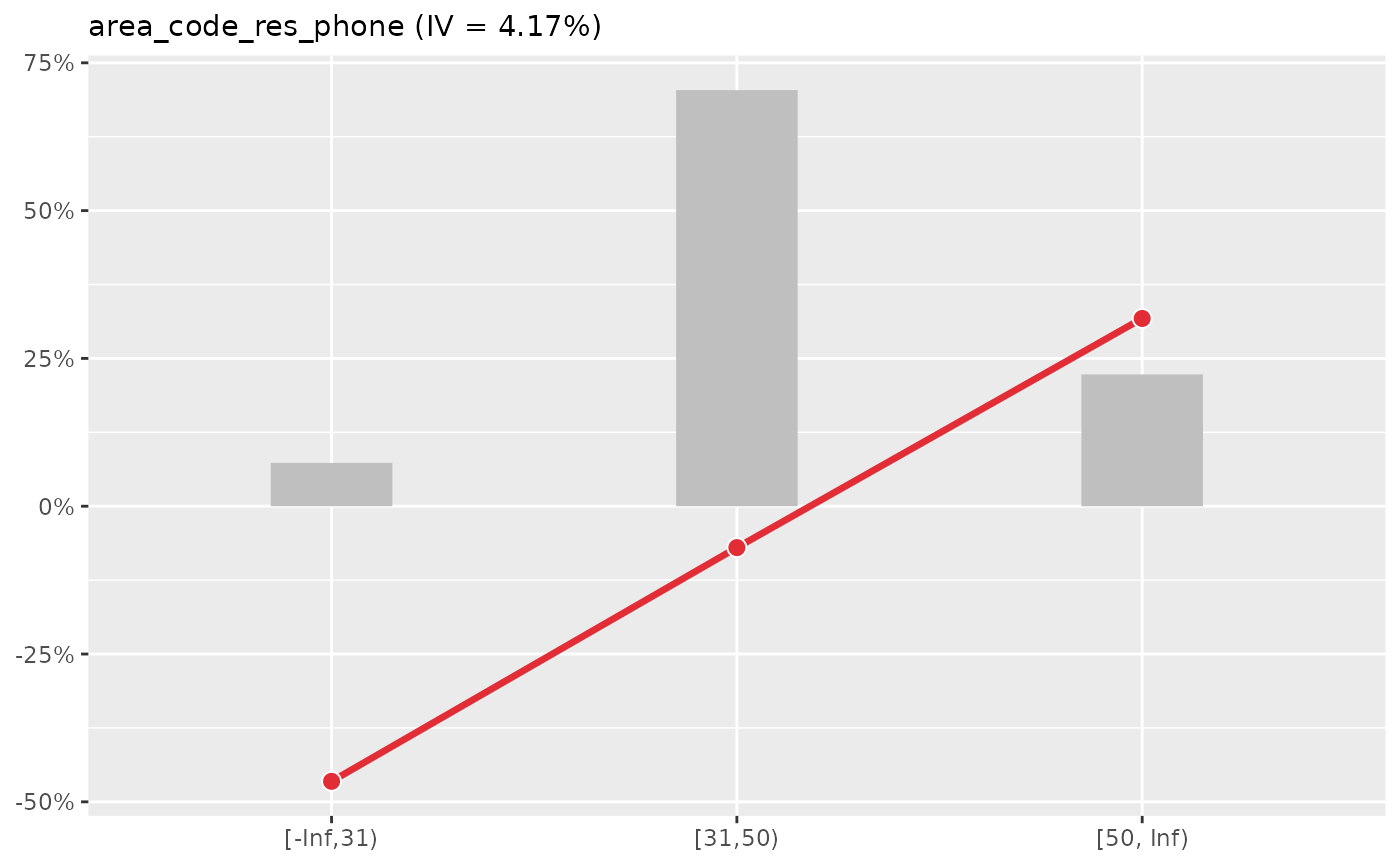 #>
gg_woes(woes, variable = "bin_iv")
#> id_client (IV = 0.42%)
#> sex (IV = 2.60%)
#> marital_status (IV = 9.60%)
#> age (IV = 19.40%)
#> flag_res_phone (IV = 7.54%)
#> area_code_res_phone (IV = 4.17%)
#> $id_client
#>
gg_woes(woes, variable = "bin_iv")
#> id_client (IV = 0.42%)
#> sex (IV = 2.60%)
#> marital_status (IV = 9.60%)
#> age (IV = 19.40%)
#> flag_res_phone (IV = 7.54%)
#> area_code_res_phone (IV = 4.17%)
#> $id_client
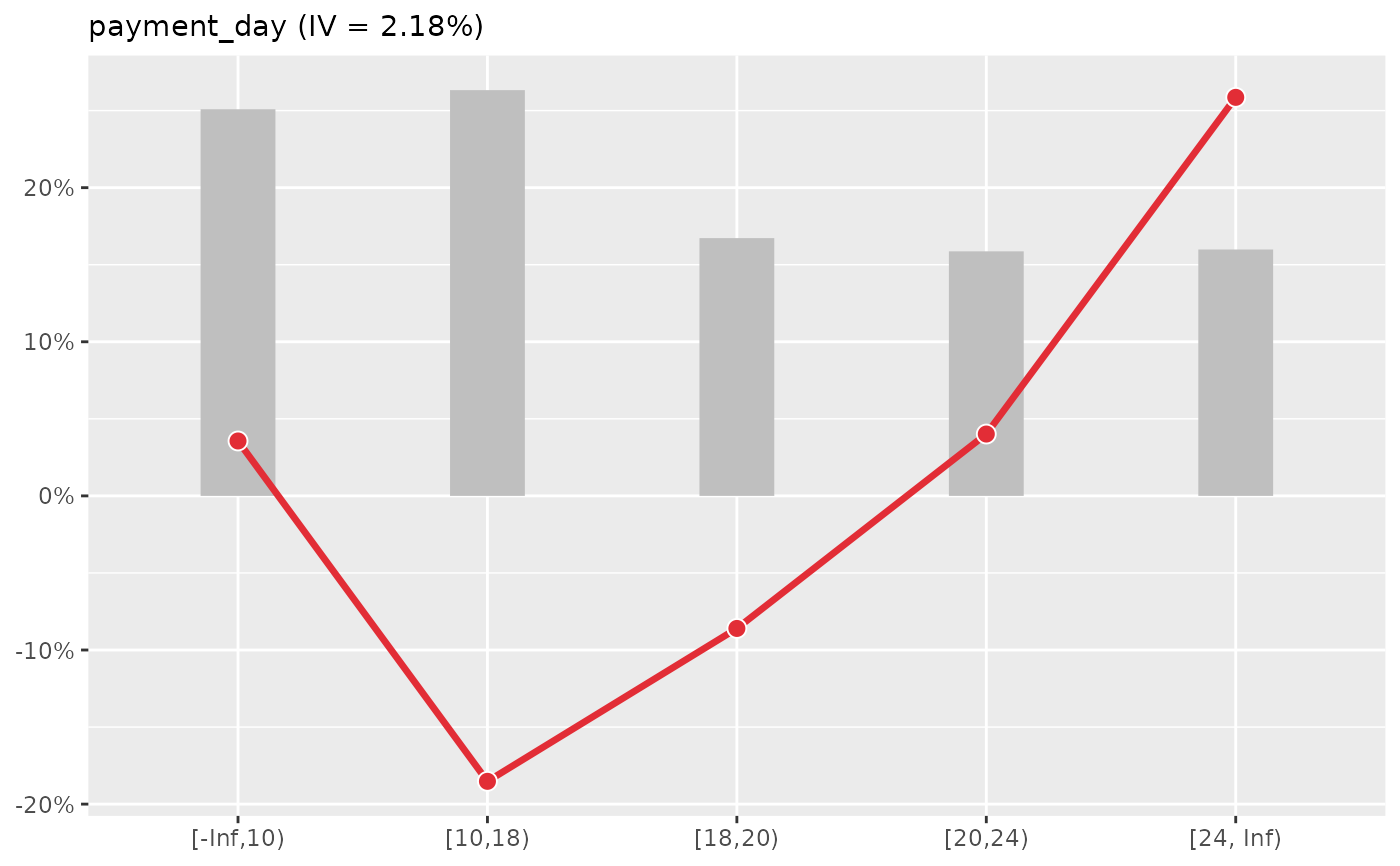 #>
#> $sex
#>
#> $sex
 #>
#> $marital_status
#>
#> $marital_status
 #>
#> $age
#>
#> $age
 #>
#> $flag_res_phone
#>
#> $flag_res_phone
 #>
#> $area_code_res_phone
#>
#> $area_code_res_phone
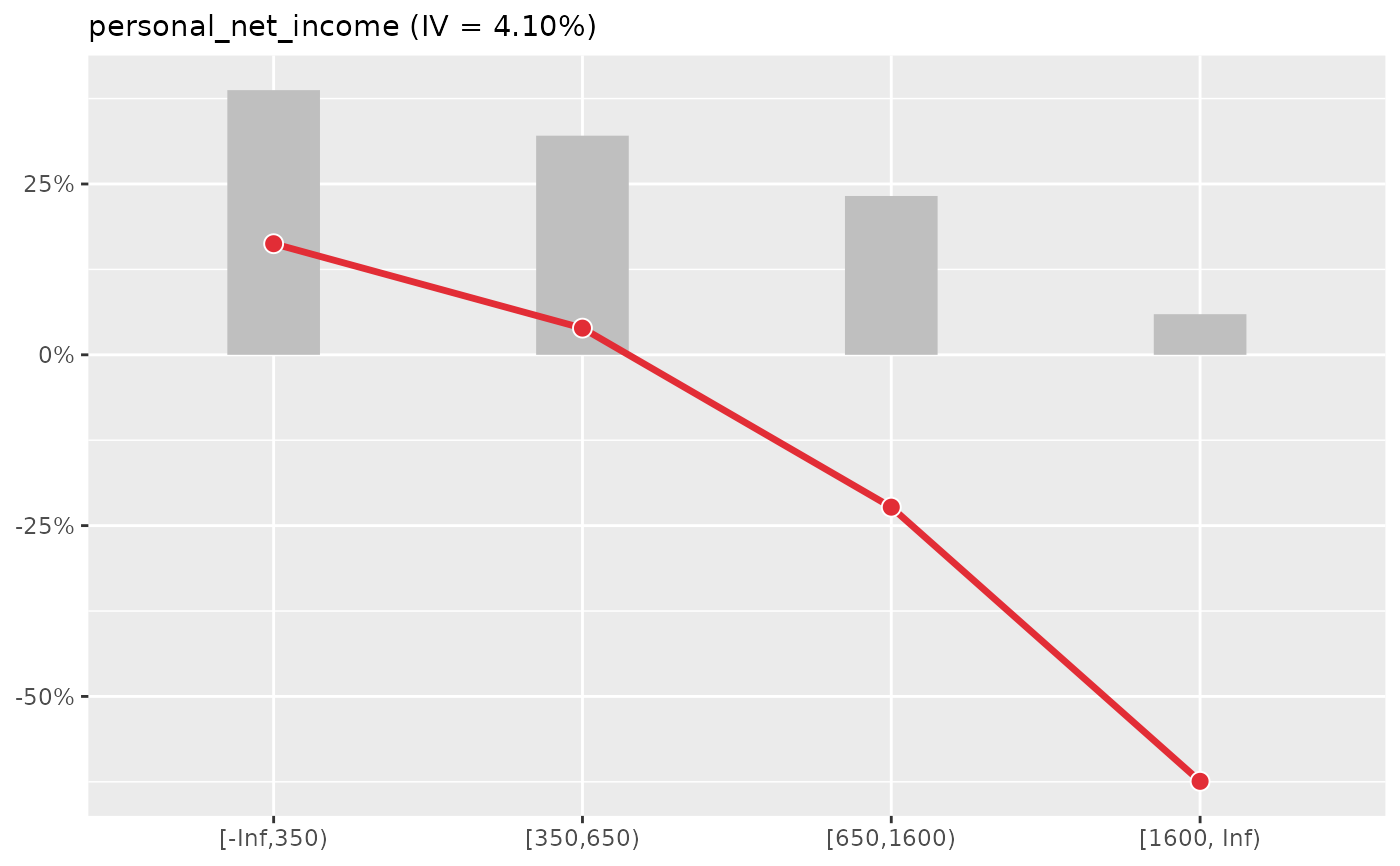 #>
#>