class: center, middle, inverse, title-slide # Visualizacion de Datos ## Una mirada desde la Estadística <html> <div style="float:left"> </div> <hr color='#272822' size=1px width=796px> </html> ### Joshua Kunst ### Diciembre 2018 --- class: center, middle, clear, bkgd-red # Contexto --- # Contexto La visualización en el Análisis de Datos 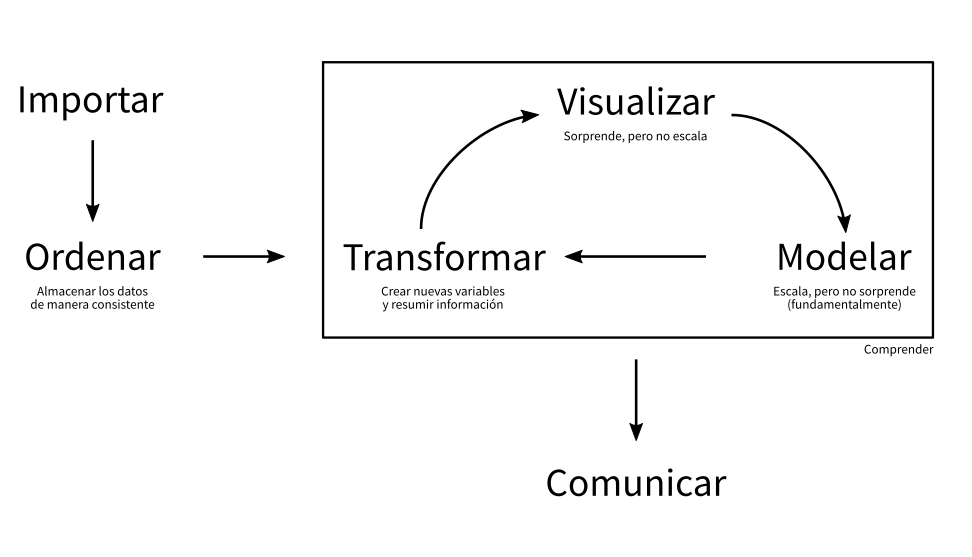 --- # Contexto La visualización codifica información 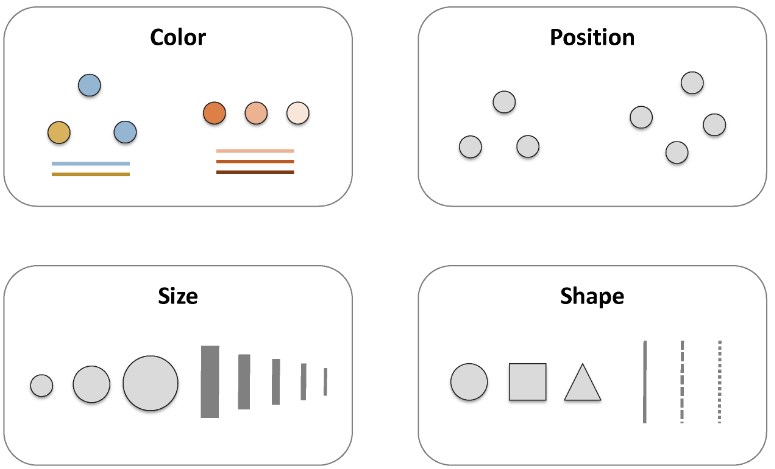 --- background-image: url(https://wallpaperplay.com/walls/full/8/b/9/112119.jpg) # Ejemplo --- # Ejemplo 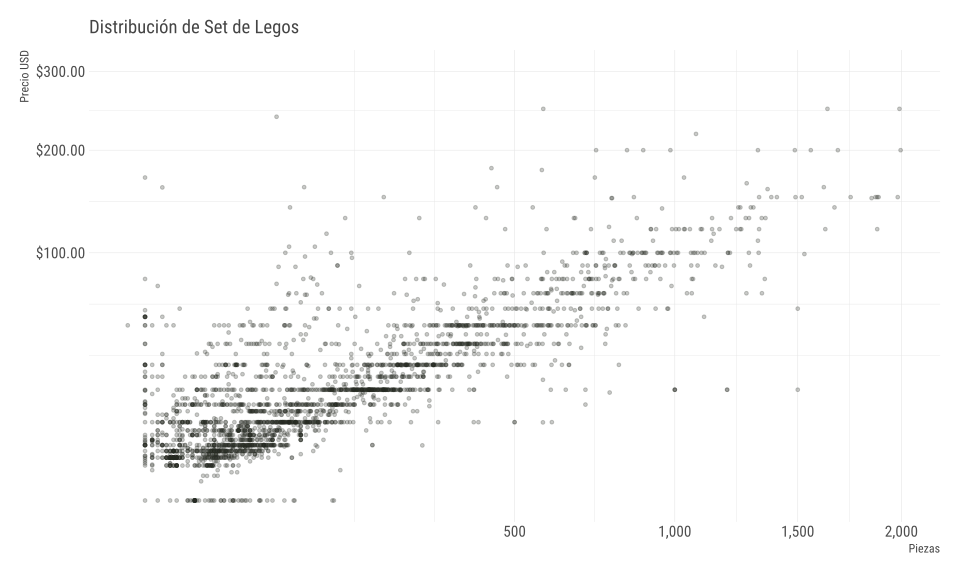<!-- --> --- # Ejemplo 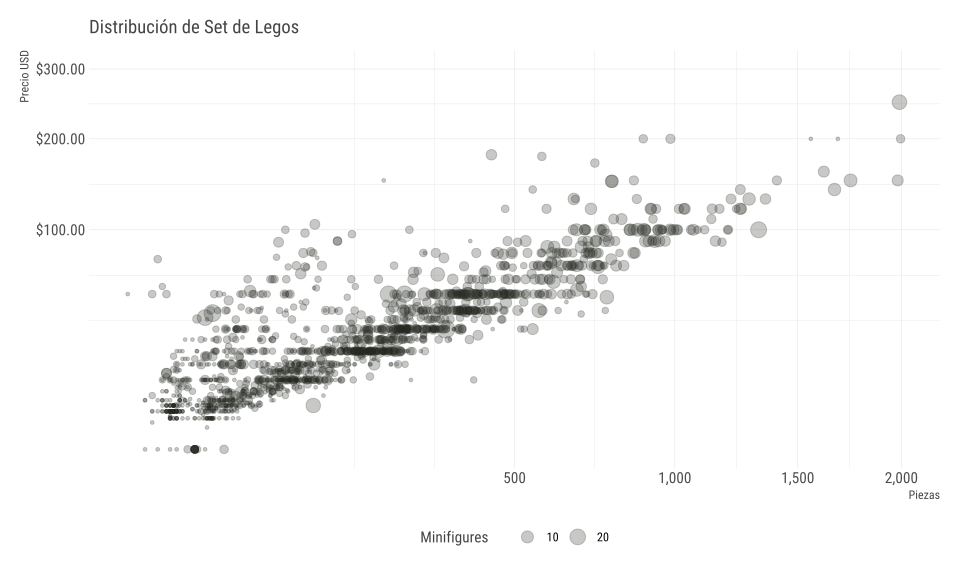<!-- --> --- # Ejemplo 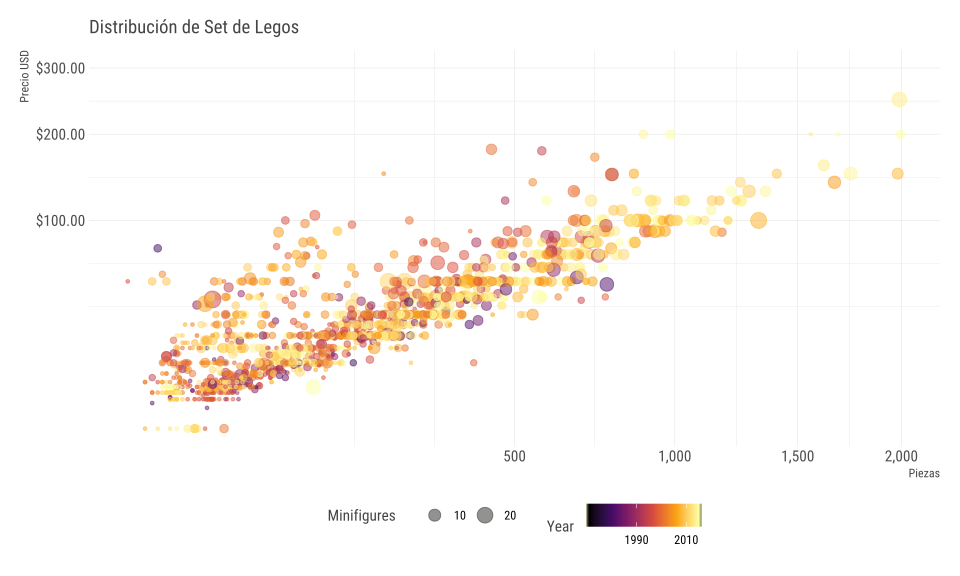<!-- --> --- # Ejemplo 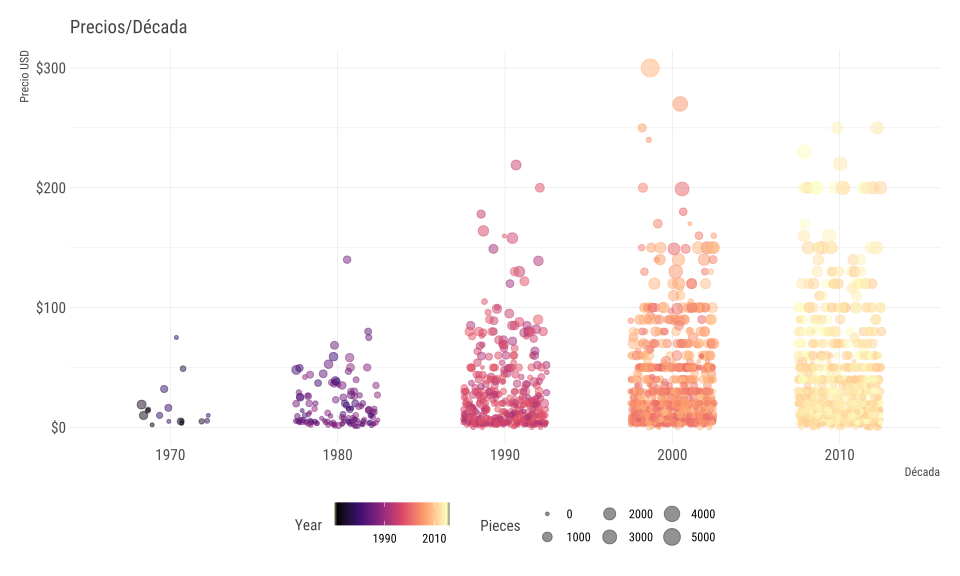<!-- --> --- class: center, middle, clear, bkgd-light-blue # Visualización Efectiva & Buenas Prácticas --- # Ejercicio ¿Existe el mejor gráfico? ¿Cuál de las siguientes formas funciona mejor con el título? -- "La región del sur exhibe el mayor crecimiento" -- <table> <thead> <tr> <th style="text-align:left;"> region </th> <th style="text-align:right;"> Q1 </th> <th style="text-align:right;"> Q2 </th> <th style="text-align:right;"> Q3 </th> <th style="text-align:right;"> Q4 </th> </tr> </thead> <tbody> <tr> <td style="text-align:left;"> sur </td> <td style="text-align:right;"> 100 </td> <td style="text-align:right;"> 150 </td> <td style="text-align:right;"> 225 </td> <td style="text-align:right;"> 290 </td> </tr> <tr> <td style="text-align:left;"> norte </td> <td style="text-align:right;"> 150 </td> <td style="text-align:right;"> 160 </td> <td style="text-align:right;"> 180 </td> <td style="text-align:right;"> 300 </td> </tr> <tr> <td style="text-align:left;"> este </td> <td style="text-align:right;"> 180 </td> <td style="text-align:right;"> 200 </td> <td style="text-align:right;"> 200 </td> <td style="text-align:right;"> 240 </td> </tr> <tr> <td style="text-align:left;"> oeste </td> <td style="text-align:right;"> 250 </td> <td style="text-align:right;"> 250 </td> <td style="text-align:right;"> 300 </td> <td style="text-align:right;"> 170 </td> </tr> </tbody> </table> --- # Ejercicio - Opción #1 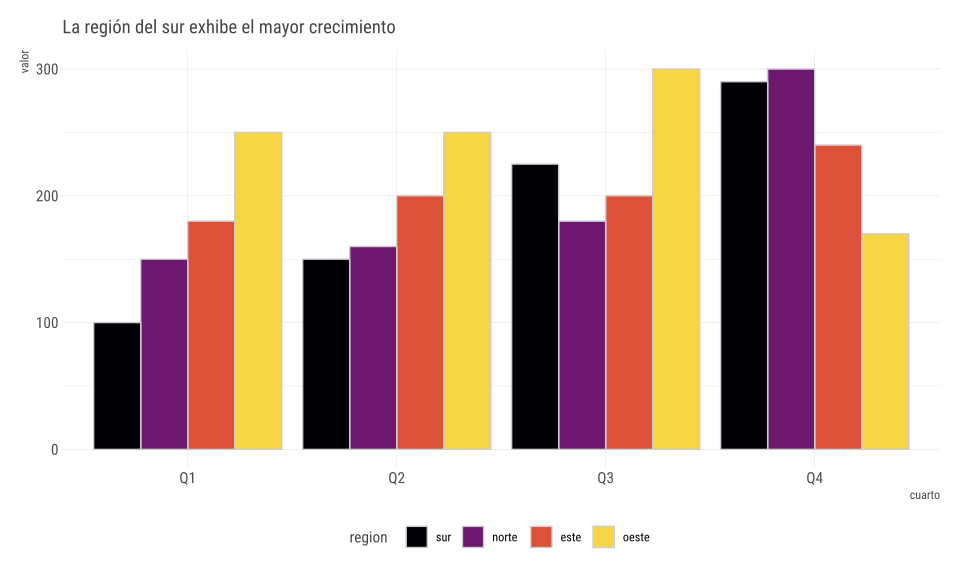<!-- --> --- # Ejercicio - Opción #2 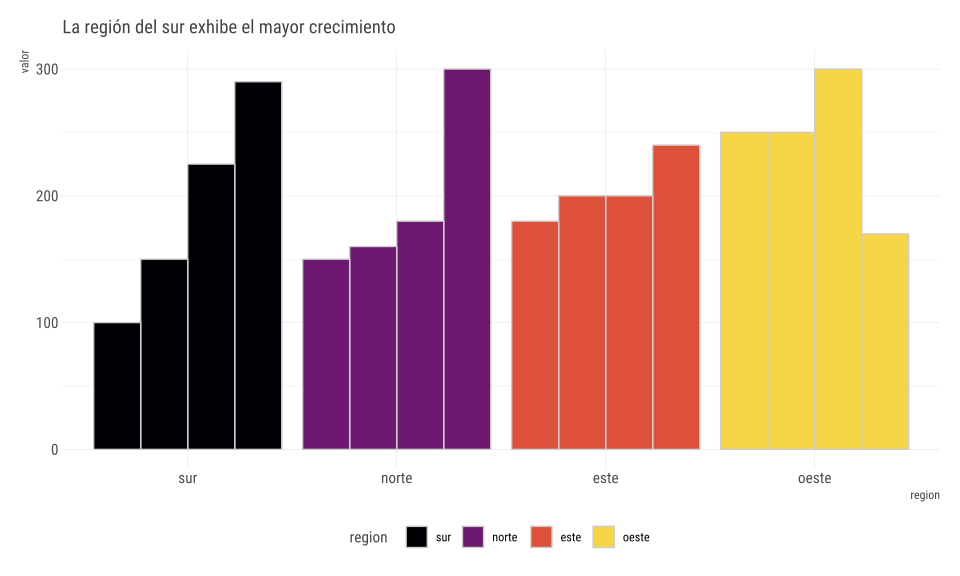<!-- --> --- # Ejercicio - Opción #3 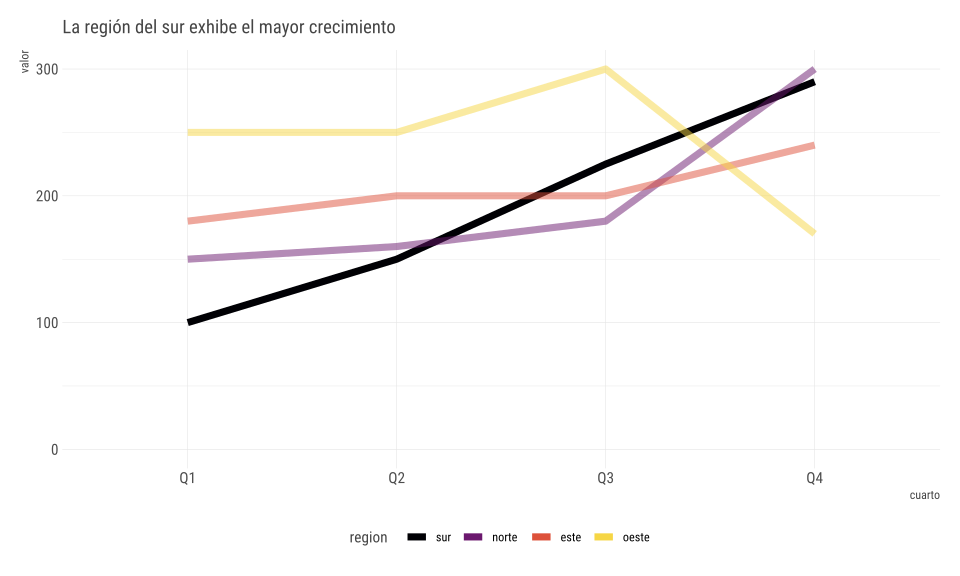<!-- --> --- # Ejercicio - Entonces? 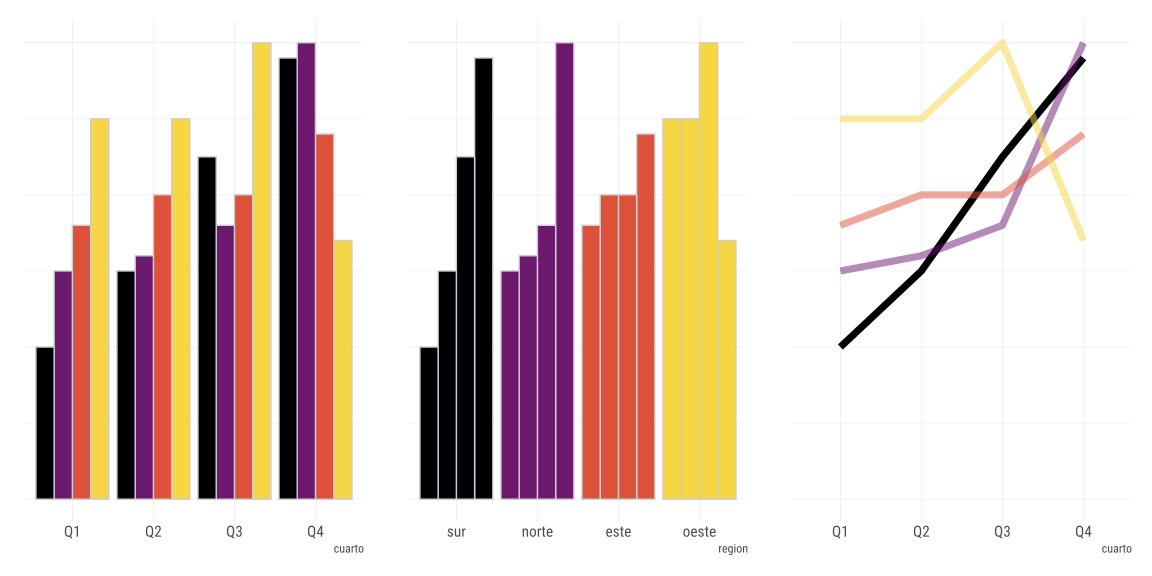<!-- --> -- (Posible) Respuesta: __No. Dependerá de tu mensaje__ --- # Pie Charts <!-- https://twitter.com/MetricsHulk/status/728014668913102848 -->  -- Usuales dificultades: Compara áreas, y rotar para comparar --- # Muy usado es el __pie chart__ 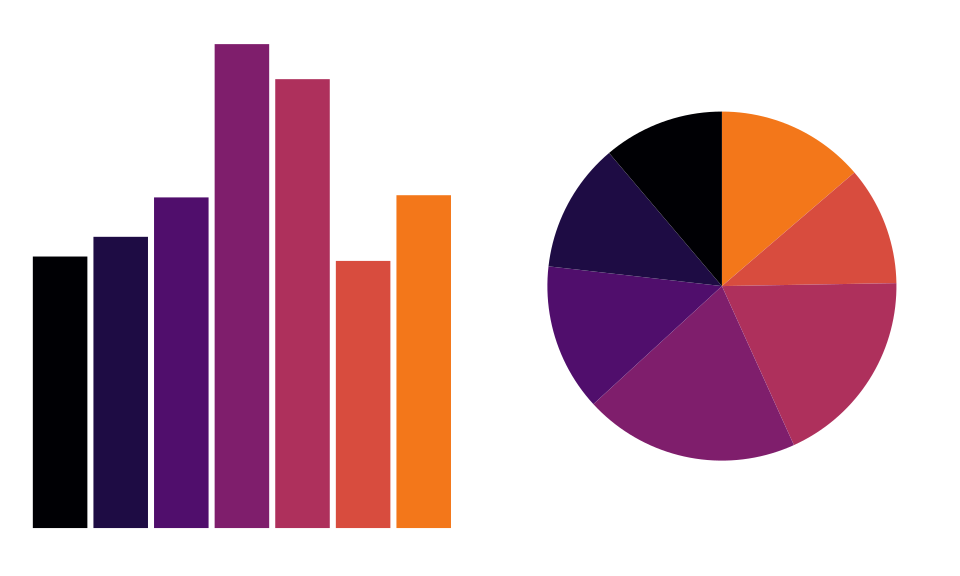<!-- --> --- # Muy (ab)usado es el __pie chart__ 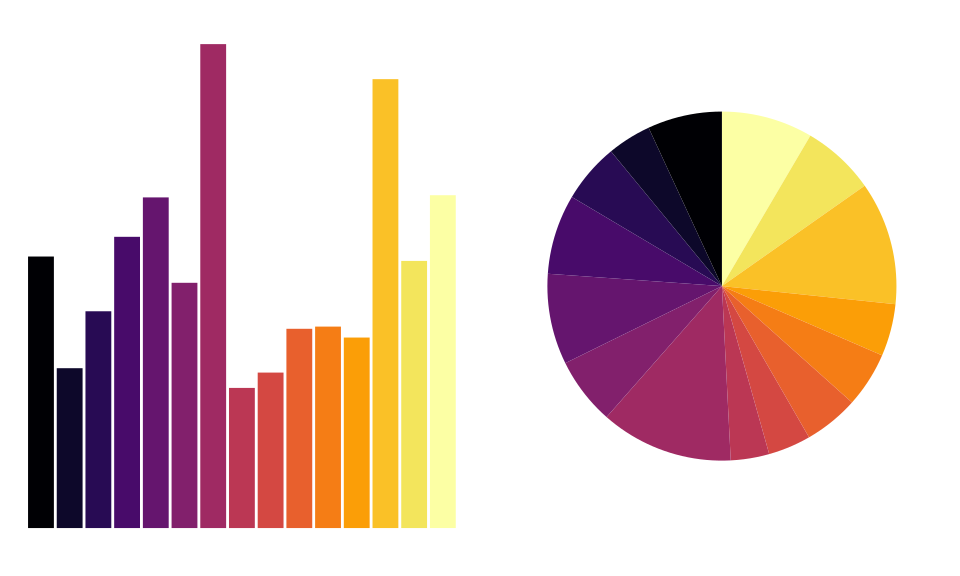<!-- --> --- # Dejar el Pie para el _postre_  --- # Convenciones Encuentre las anomalías -- .center[ <img src="https://pbs.twimg.com/media/CjZ9zUjWUAAkWEt.jpg" width="40%" /> ] --- # Convenciones Rápidamente ¿Dónde se produce el máximo de muertes por arma? -- .center[ <img src="imgs/gun.jpg" width="40%" /> ] --- # Tipografías  --- # Colores La misma idea de las convenciones! -- .center[ <h1> <span style="color:gray">1 2 3 8 9 </span><span style="color:red">4 </span><span style="color:gray">1 4</span> </h1> ] -- - Dar foco y llamar la atención -- - Debiesen ser corcondantes con el dato --- class: center, middle, clear, bkgd-green # Poniendo en práctica --- # Datos Ingresos de usuarios a estaciones de metros (+100) cada media hora <table> <thead> <tr> <th style="text-align:left;"> paraderosubida </th> <th style="text-align:left;"> mediahora </th> <th style="text-align:right;"> subidas_laboral_promedio </th> </tr> </thead> <tbody> <tr> <td style="text-align:left;"> ALCANTARA </td> <td style="text-align:left;"> 05:30:00 </td> <td style="text-align:right;"> 2.6 </td> </tr> <tr> <td style="text-align:left;"> ALCANTARA </td> <td style="text-align:left;"> 06:00:00 </td> <td style="text-align:right;"> 13.2 </td> </tr> <tr> <td style="text-align:left;"> ALCANTARA </td> <td style="text-align:left;"> 06:30:00 </td> <td style="text-align:right;"> 53.4 </td> </tr> <tr> <td style="text-align:left;"> ALCANTARA </td> <td style="text-align:left;"> 07:00:00 </td> <td style="text-align:right;"> 184.8 </td> </tr> <tr> <td style="text-align:left;"> ALCANTARA </td> <td style="text-align:left;"> 07:30:00 </td> <td style="text-align:right;"> 364.0 </td> </tr> </tbody> </table> -- La idea es obtener conocimiento de estos datos --- # Simple <!-- --> -- Es bueno equivocarse --- # Simple 2 <!-- --> --- # Menos simple <!-- --> -- correlación: 0.996 --- # Menos simple 2 <!-- --> -- correlación: -0.436 --- # Correlaciones Las correlaciones nos dan una métrica de que tanto se parecen unas estaciones de otras -- ¿Las obtenemos todas y graficamos? --- # Correlaciones 2 <!-- --> --- # Correlaciones 3 <!-- --> --- # Correlaciones 4 <!-- --> --- # Reducción De dimensionalidad -- Hasta ahora hemos usado solamente *correlaciones* que miden asociacion lineal y no es um indicador necesariamente robusto para usarlo como métrica de distancia -- Usaremos todos los datos por estacion y usaremos __UMAP__, un algoritmo para _resumir_ toda la información en *2* columnas/variables -- Similares son: PCA, T-SNE, Autoencoders --- # Reducción De dimensionalidad Lleva de <table> <thead> <tr> <th style="text-align:left;"> paraderosubida </th> <th style="text-align:right;"> 05:30:00 </th> <th style="text-align:right;"> 06:00:00 </th> <th style="text-align:right;"> 06:30:00 </th> <th style="text-align:right;"> 07:00:00 </th> <th style="text-align:right;"> 07:30:00 </th> </tr> </thead> <tbody> <tr> <td style="text-align:left;"> ALCANTARA </td> <td style="text-align:right;"> 2.6 </td> <td style="text-align:right;"> 13.2 </td> <td style="text-align:right;"> 53.4 </td> <td style="text-align:right;"> 184.8 </td> <td style="text-align:right;"> 364.0 </td> </tr> <tr> <td style="text-align:left;"> BAQUEDANO L1 </td> <td style="text-align:right;"> 86.6 </td> <td style="text-align:right;"> 125.4 </td> <td style="text-align:right;"> 208.4 </td> <td style="text-align:right;"> 397.8 </td> <td style="text-align:right;"> 521.6 </td> </tr> <tr> <td style="text-align:left;"> BAQUEDANO L5 </td> <td style="text-align:right;"> 1.4 </td> <td style="text-align:right;"> 7.2 </td> <td style="text-align:right;"> 26.2 </td> <td style="text-align:right;"> 95.6 </td> <td style="text-align:right;"> 199.8 </td> </tr> </tbody> </table> A <table> <thead> <tr> <th style="text-align:left;"> paraderosubida </th> <th style="text-align:right;"> V1 </th> <th style="text-align:right;"> V2 </th> </tr> </thead> <tbody> <tr> <td style="text-align:left;"> ALCANTARA </td> <td style="text-align:right;"> 1.1842350 </td> <td style="text-align:right;"> -1.4382061 </td> </tr> <tr> <td style="text-align:left;"> BAQUEDANO L1 </td> <td style="text-align:right;"> 2.8126349 </td> <td style="text-align:right;"> -0.9909196 </td> </tr> <tr> <td style="text-align:left;"> BAQUEDANO L5 </td> <td style="text-align:right;"> 0.5387482 </td> <td style="text-align:right;"> -1.6797349 </td> </tr> </tbody> </table> --- # Reducción De dimensionalidad <!-- --> --- # Reducción De dimensionalidad <!-- --> --- # Reducción De dimensionalidad <!-- --> --- # Finalmente <!-- --> --- class: center, middle, clear, bkgd-amber # Resumiendo --- # Resumiendo La visualización... - Lleva información, mensaje -- - Ejercicio mental para decodificar información -- - No siempre es el fin -- - Herramienta exploratoria -- - Distintas visualizaciones en mismos datos son distintas historias -- Y todo mejora, cuando agregamos un poco más de metodologías cuantitavias o predicitivas! --- class: center, middle, clear, bkgd-green # Eso ;)! Gracias