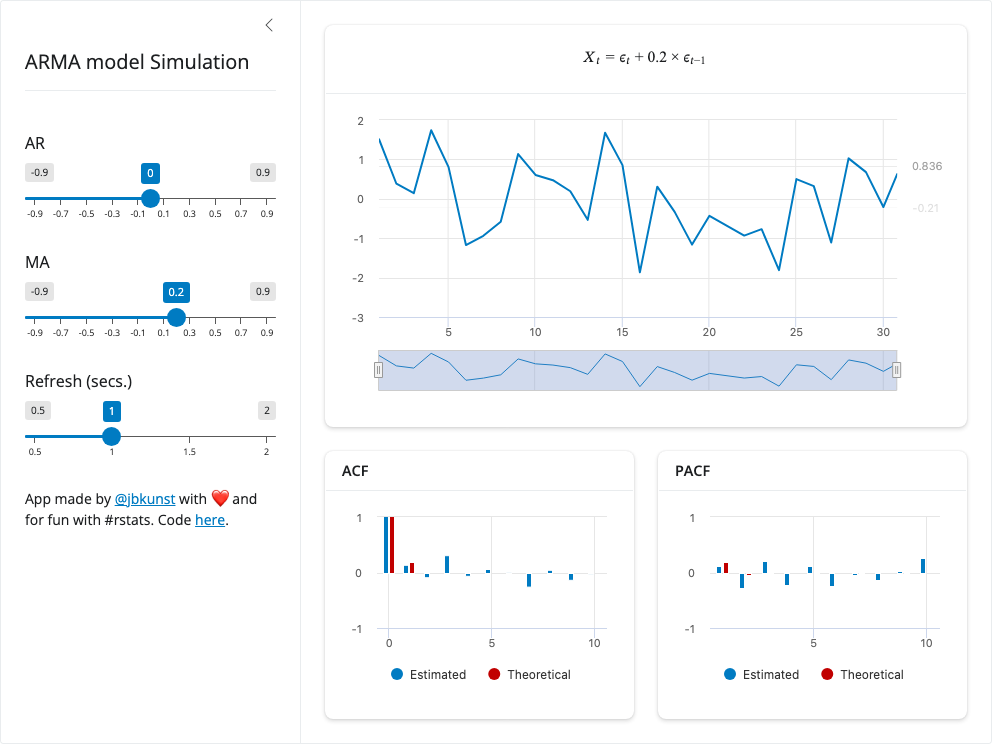
See how AR and MA settings change a simulated time series and its autocorrelation patterns.
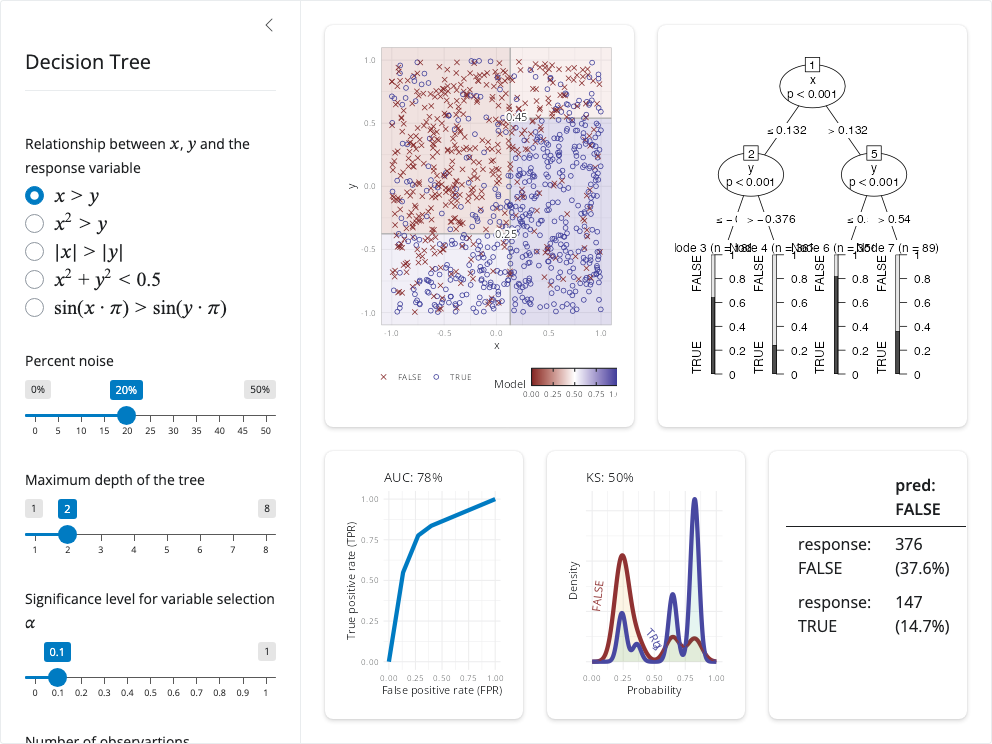
Build synthetic classification data and watch a decision tree carve the feature space into regions.
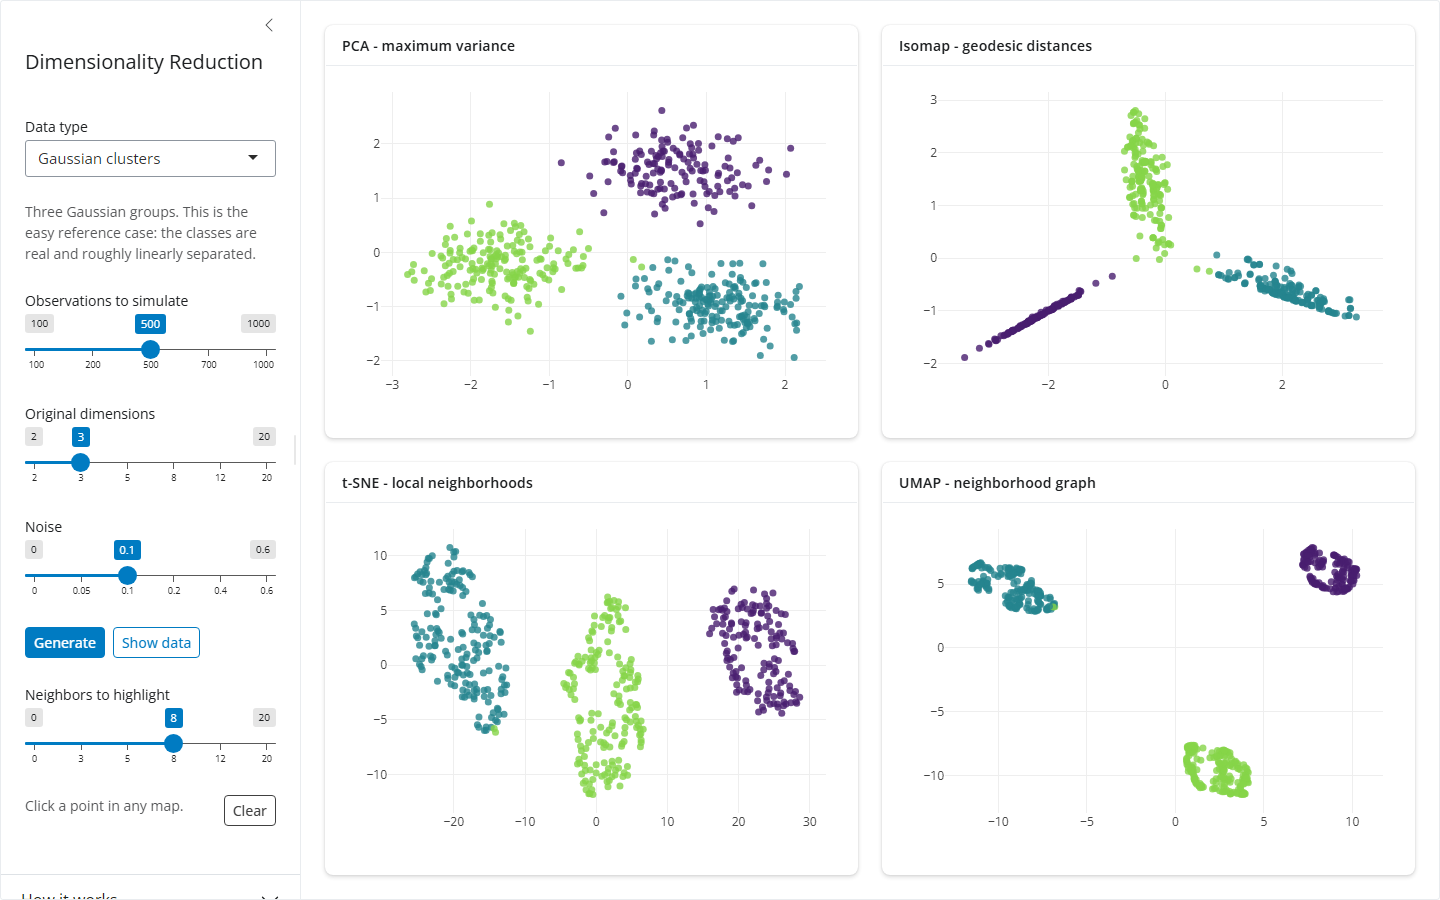
Compare PCA, Isomap, t-SNE, and UMAP on simulated and real high-dimensional datasets.
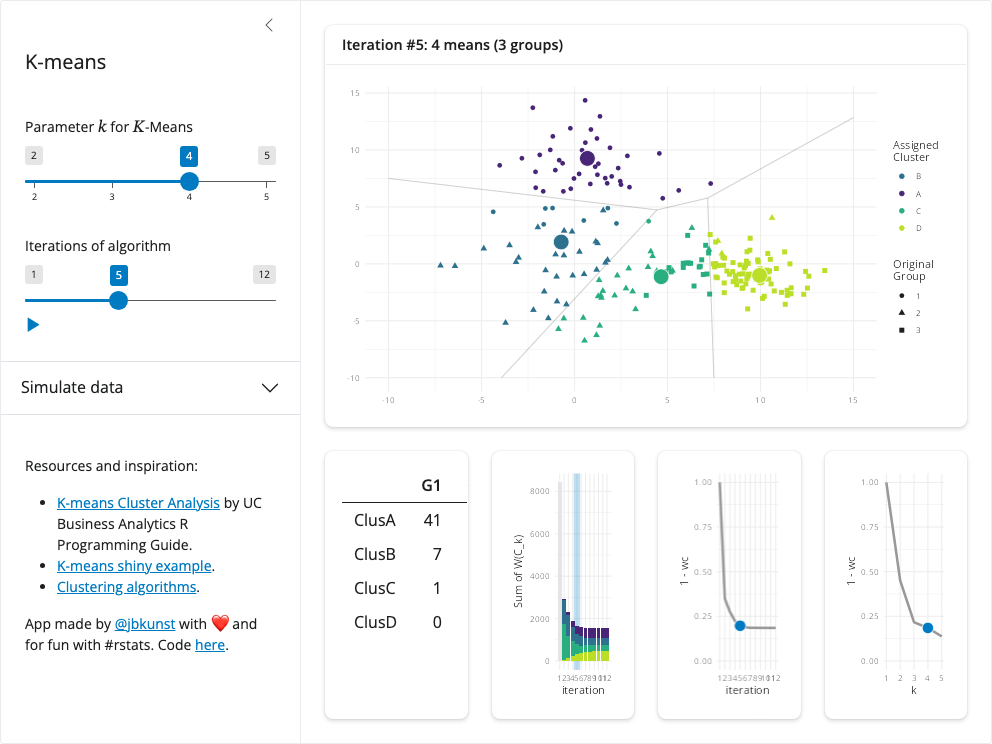
Move through each K-means iteration to see centers, assignments, and convergence on generated clusters.
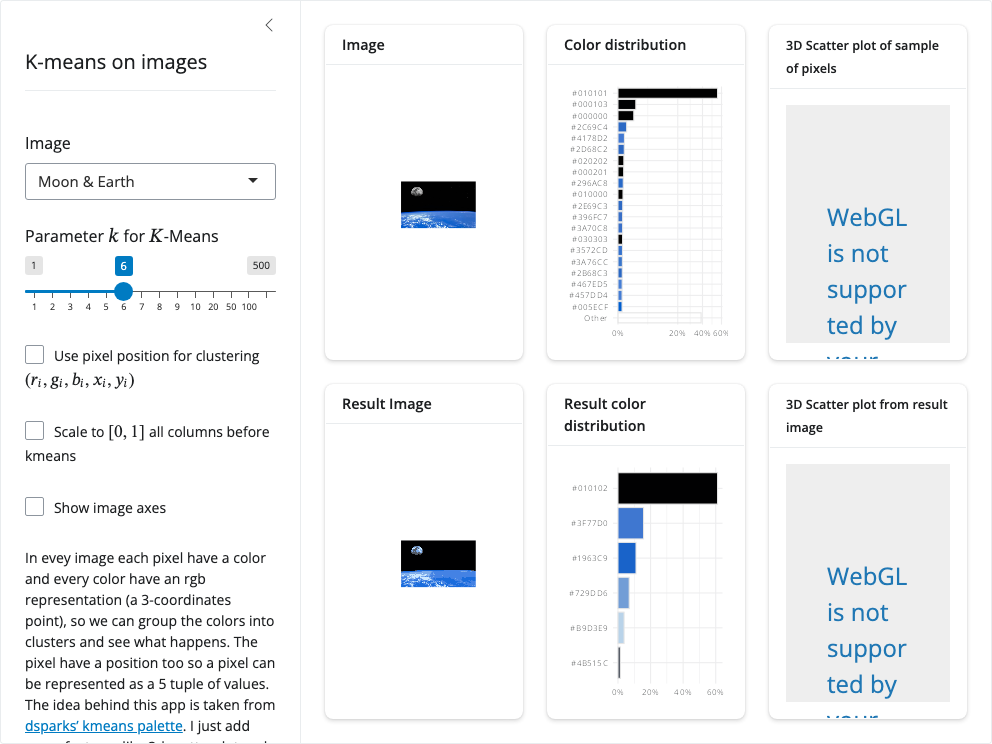
Apply K-means to image colors and compare the original image with a compressed color version.
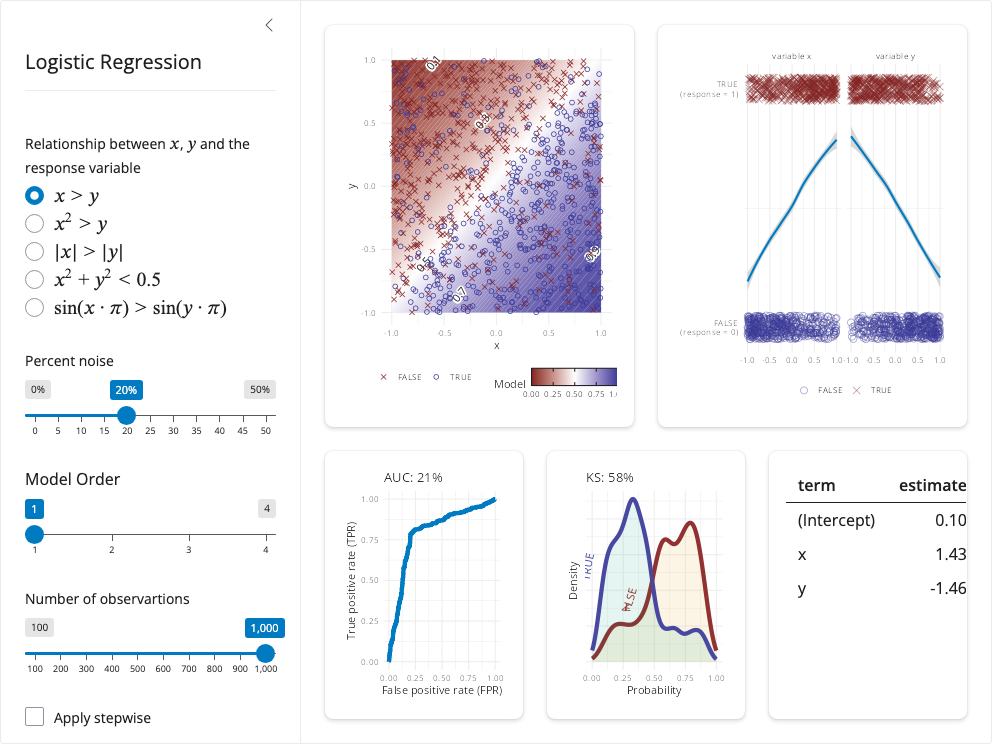
Change noise, polynomial terms, and class structure to see how logistic regression shapes decision boundaries.
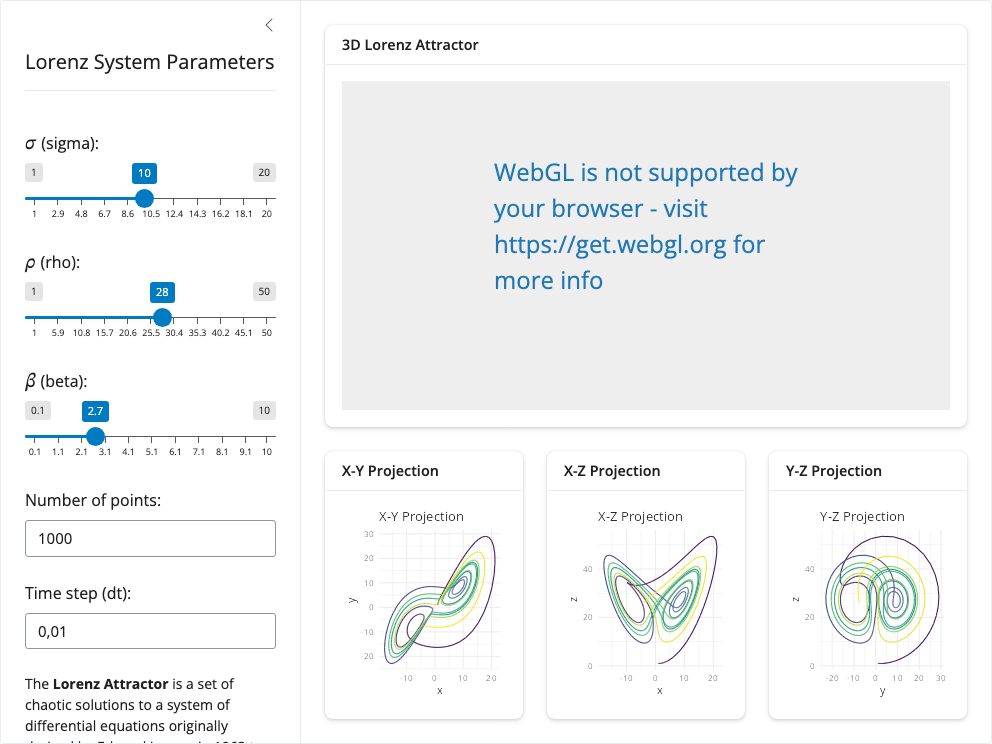
Adjust the Lorenz parameters and watch how small changes produce chaotic 3D trajectories.
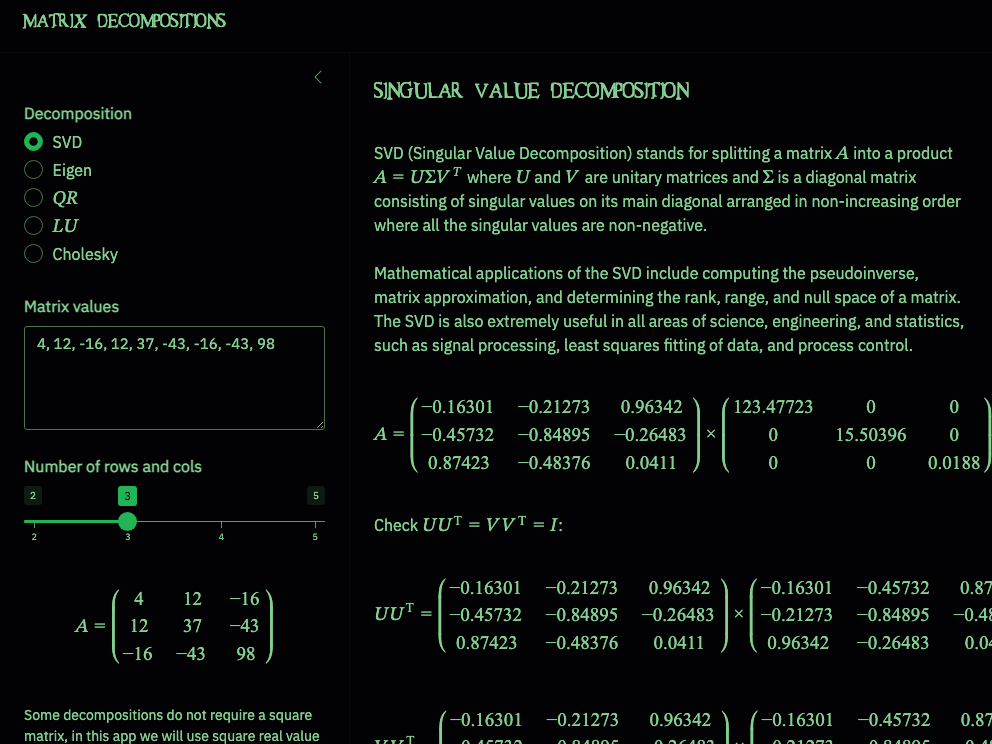
Create matrices and compare how common decompositions reveal structure from different angles.
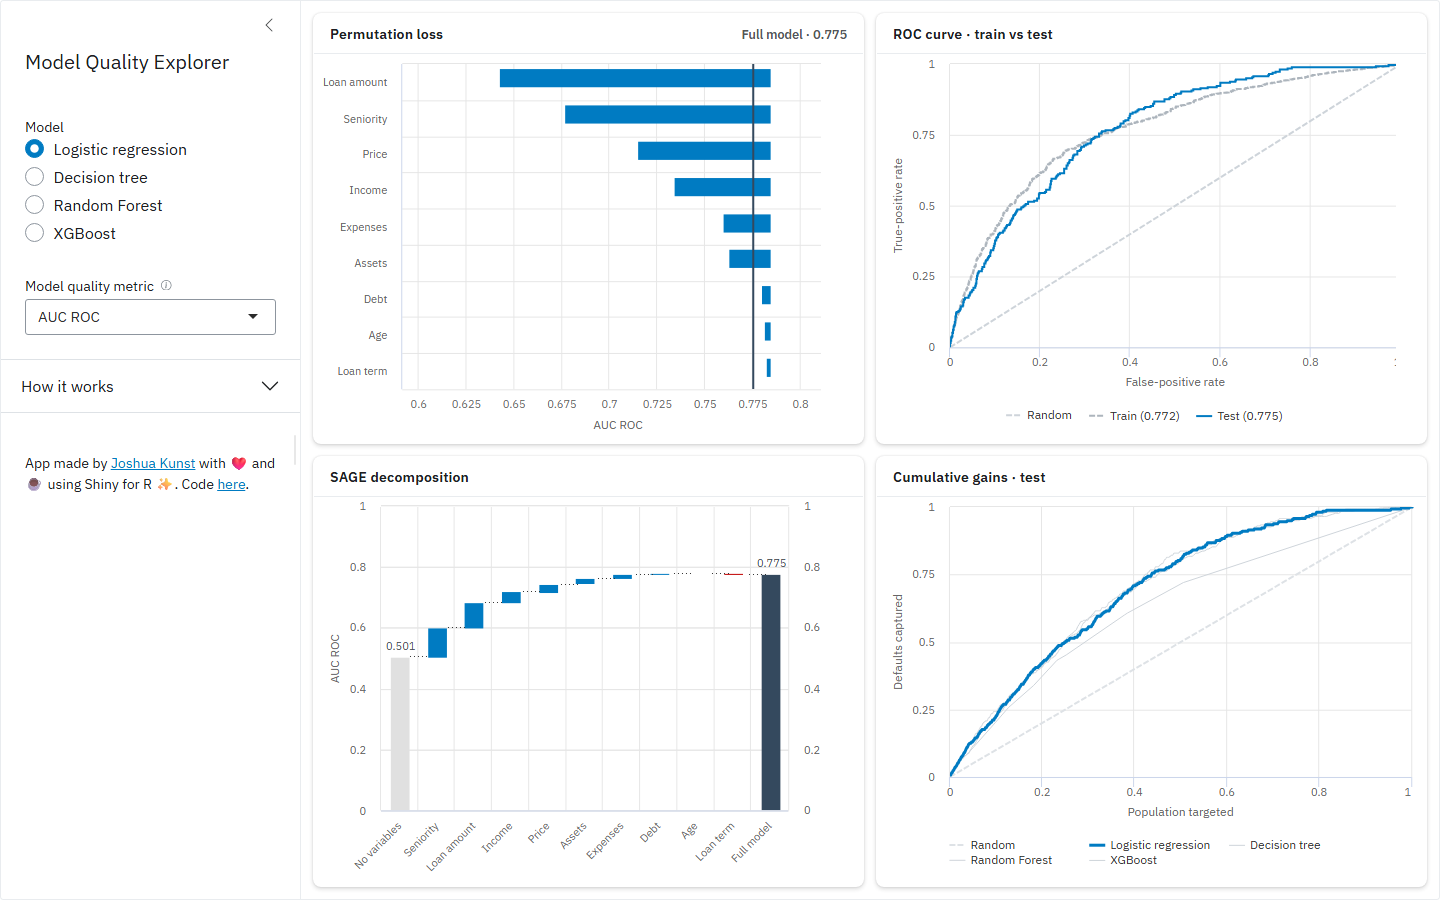
Explore how variables build or reduce credit-model quality through permutation, SAGE, metric diagnostics, and cumulative gains.
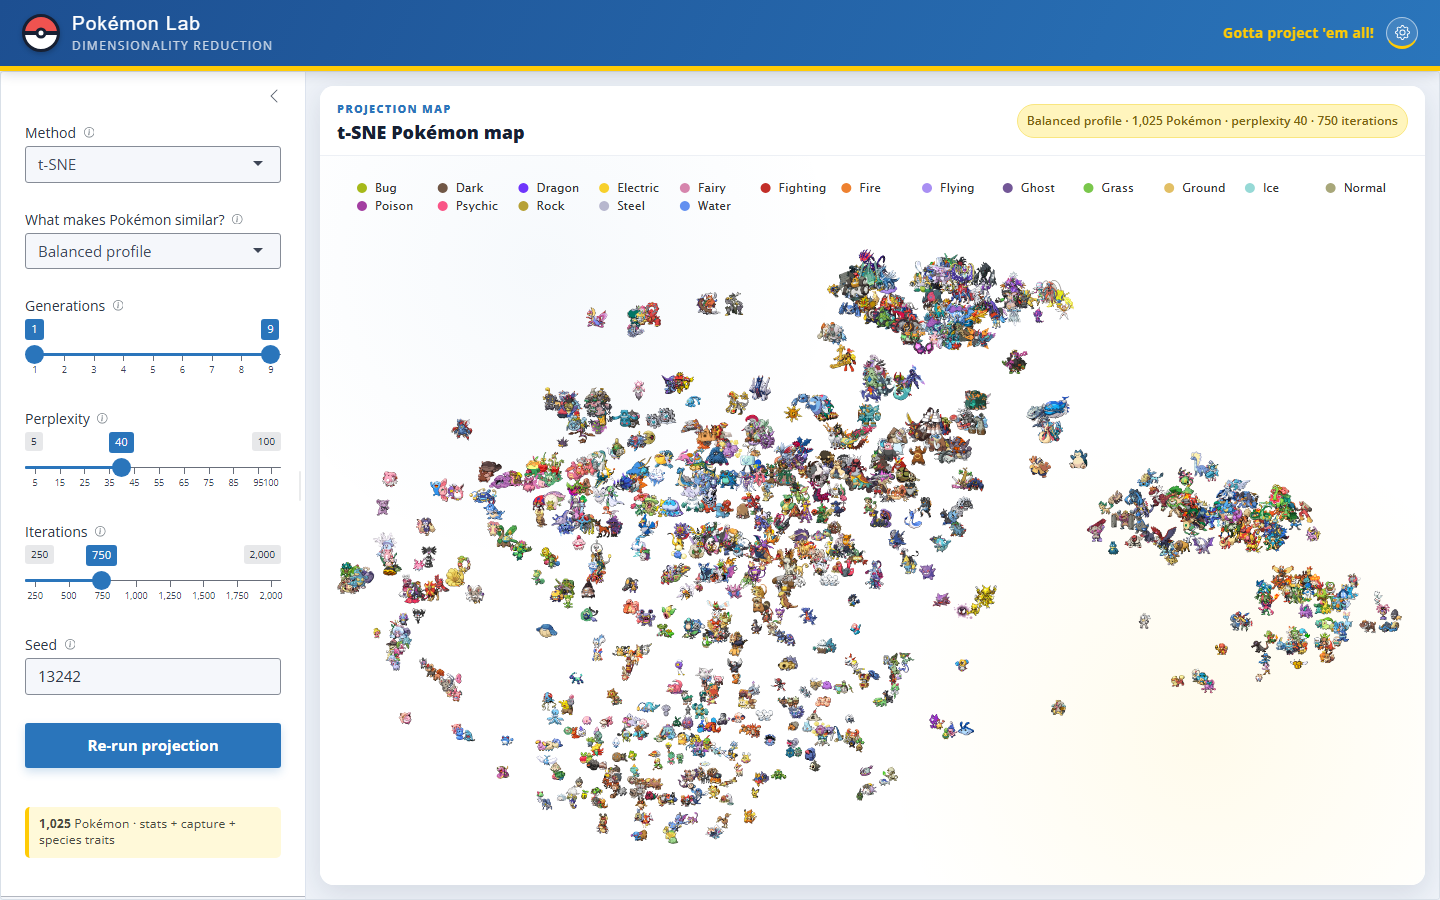
Explore how PCA, t-SNE, and UMAP arrange Pokémon using stats, types, and egg groups.
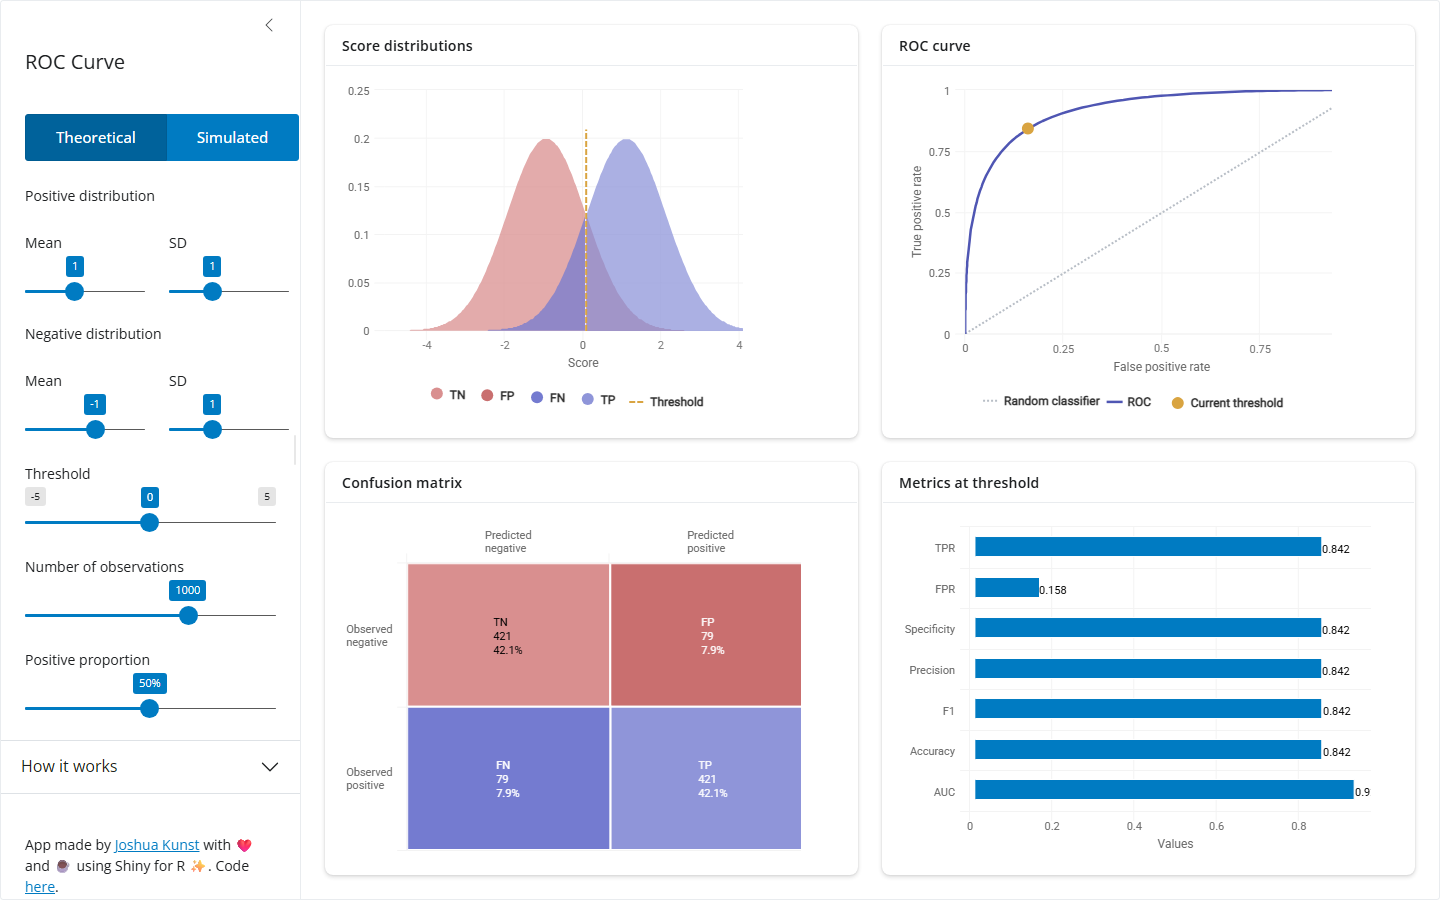
Explore how score distributions, class balance, and thresholds shape ROC curves and classification metrics.
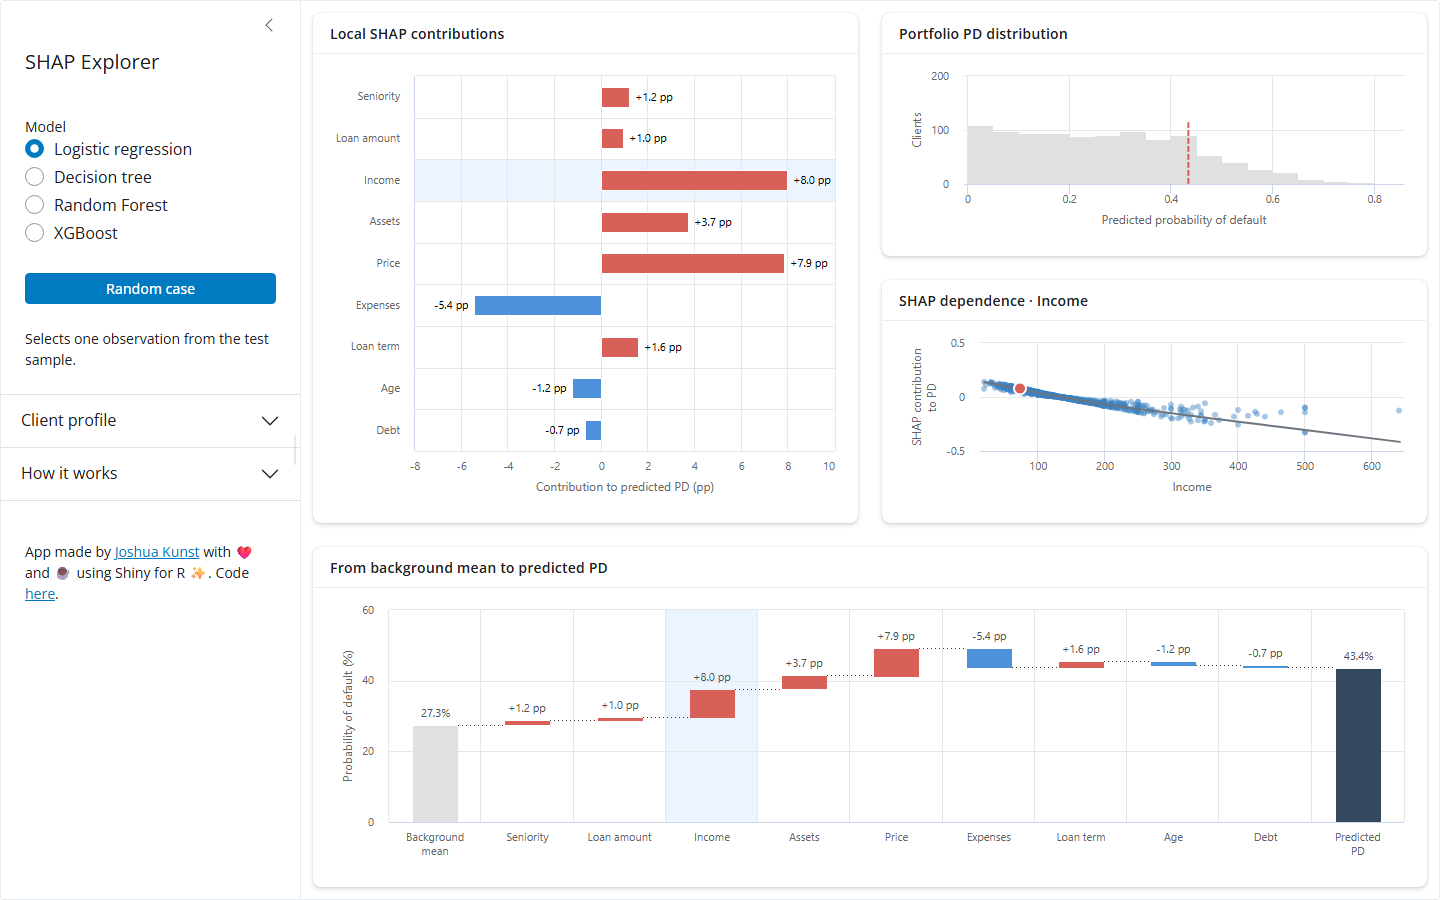
Explore how different credit-risk models turn a client profile into a probability of default and SHAP contributions.
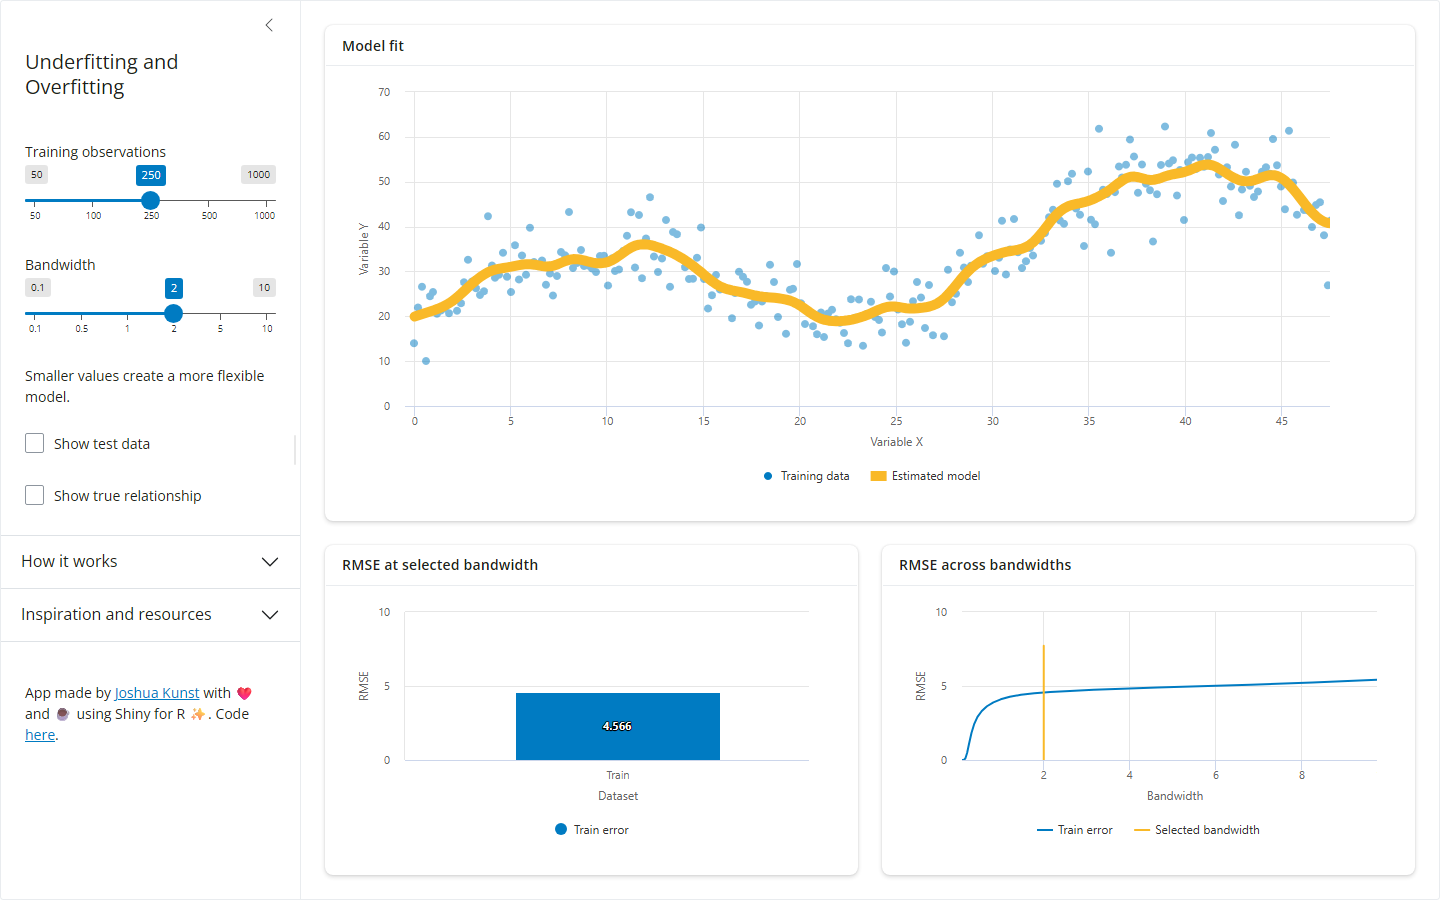
Adjust a kernel smoother and reveal test data and the true relationship to explore model flexibility and generalization.
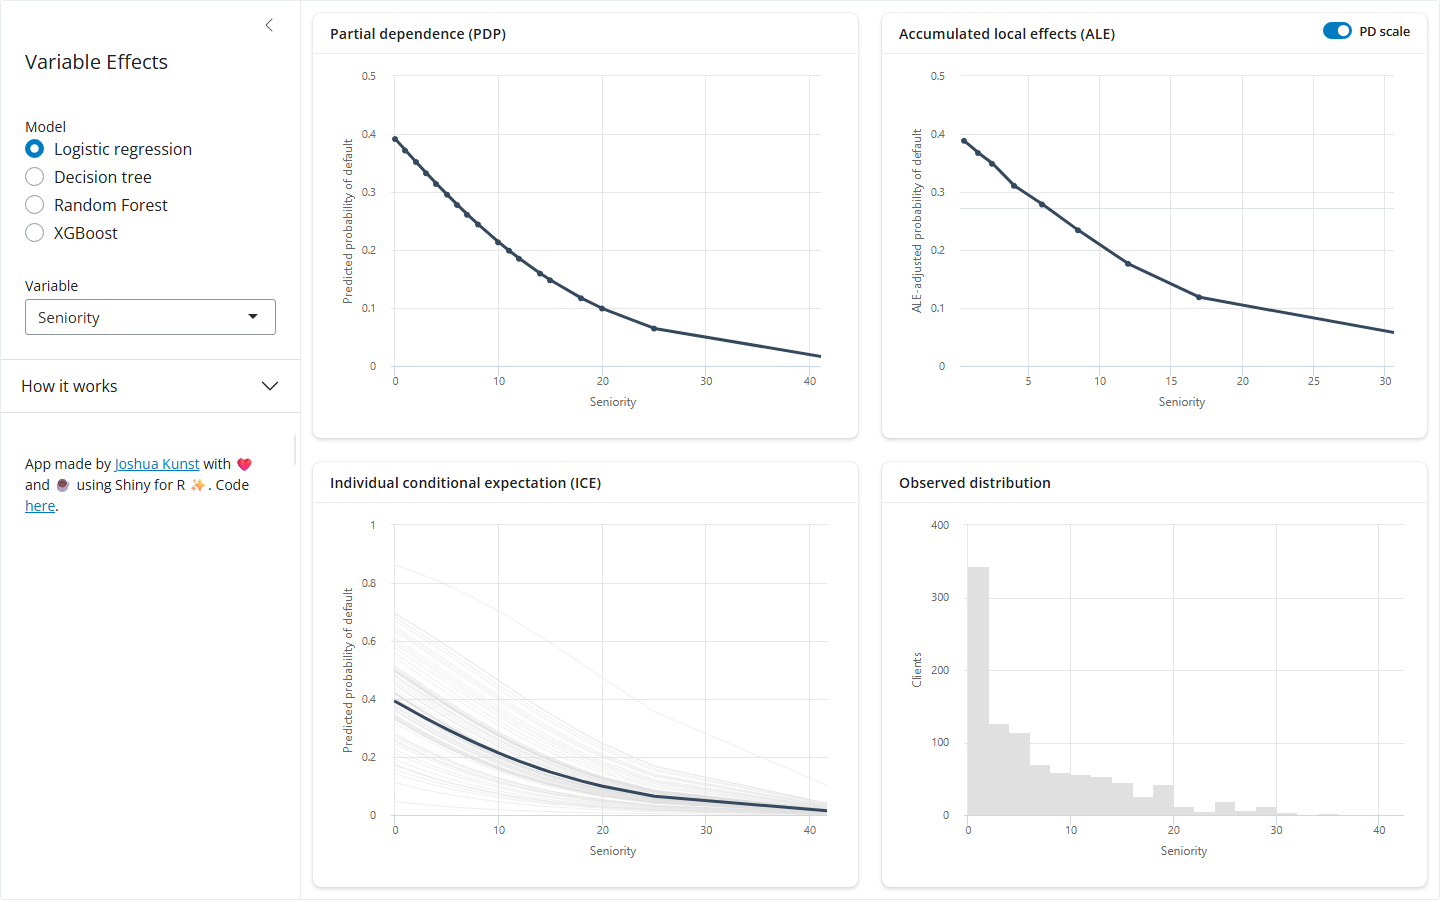
Compare how credit-risk models respond to each predictor using PDP, ALE, ICE, and the observed distribution.
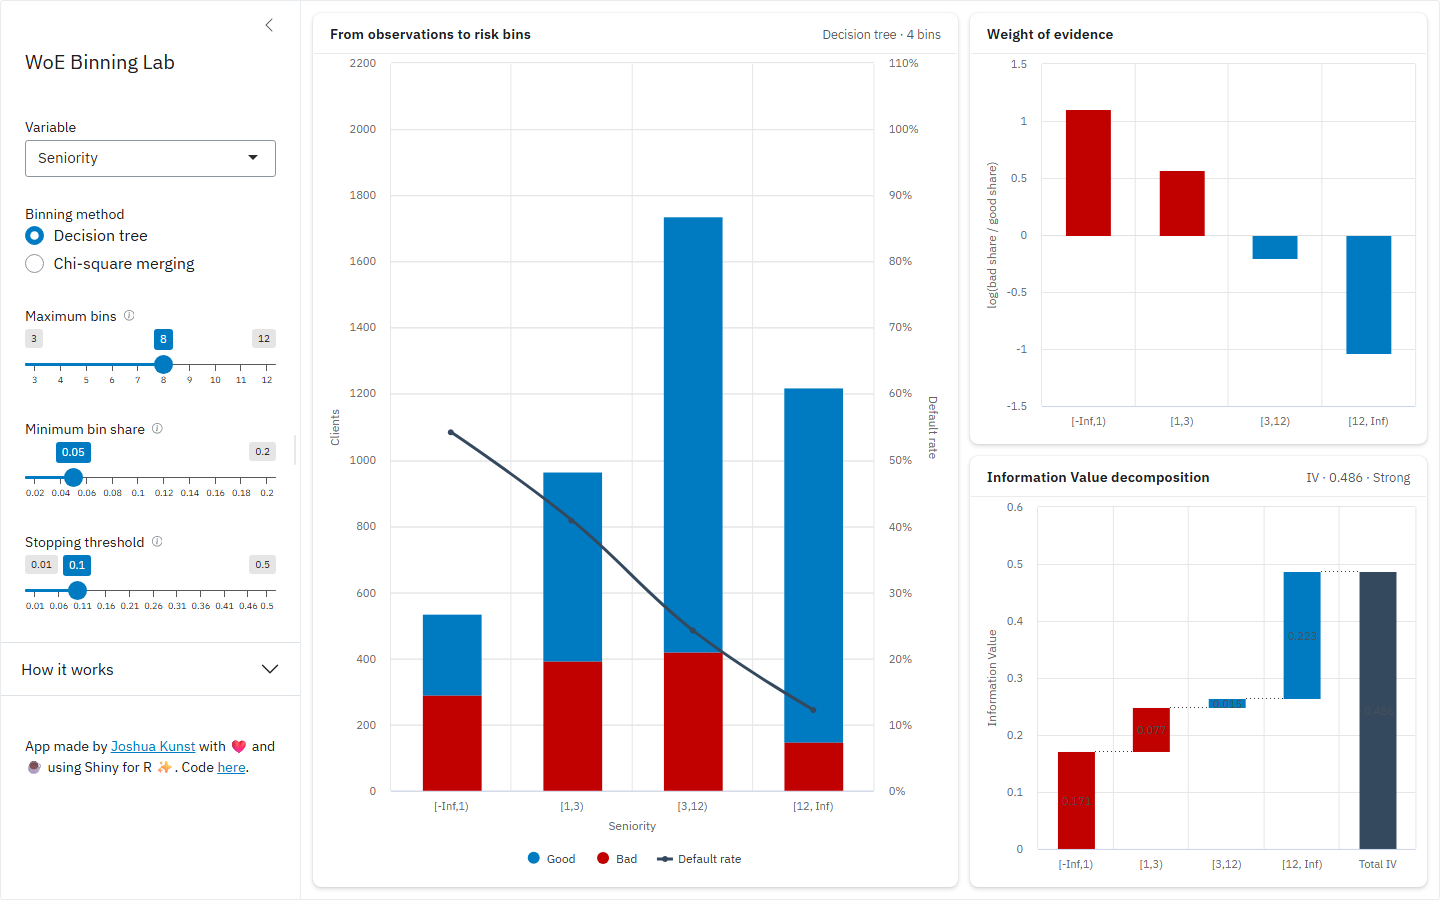
Explore how risk3r binning parameters transform credit-risk predictors into Weight of Evidence and Information Value.