Fit classification tree to klassets_response_xy object
Source: R/response_xy.R
fit_classification_tree.RdFit classification tree to klassets_response_xy object
Arguments
- df
A object from
sim_response_xy.- type
Type of prediction, one of prob, response, node.
- maxdepth
Max depth of the tree. Same used in
partykit::ctree_control.- alpha
Alpha value, same used in
partykit::ctree_control- ...
Options for
partykit::ctree_control.
Examples
set.seed(123)
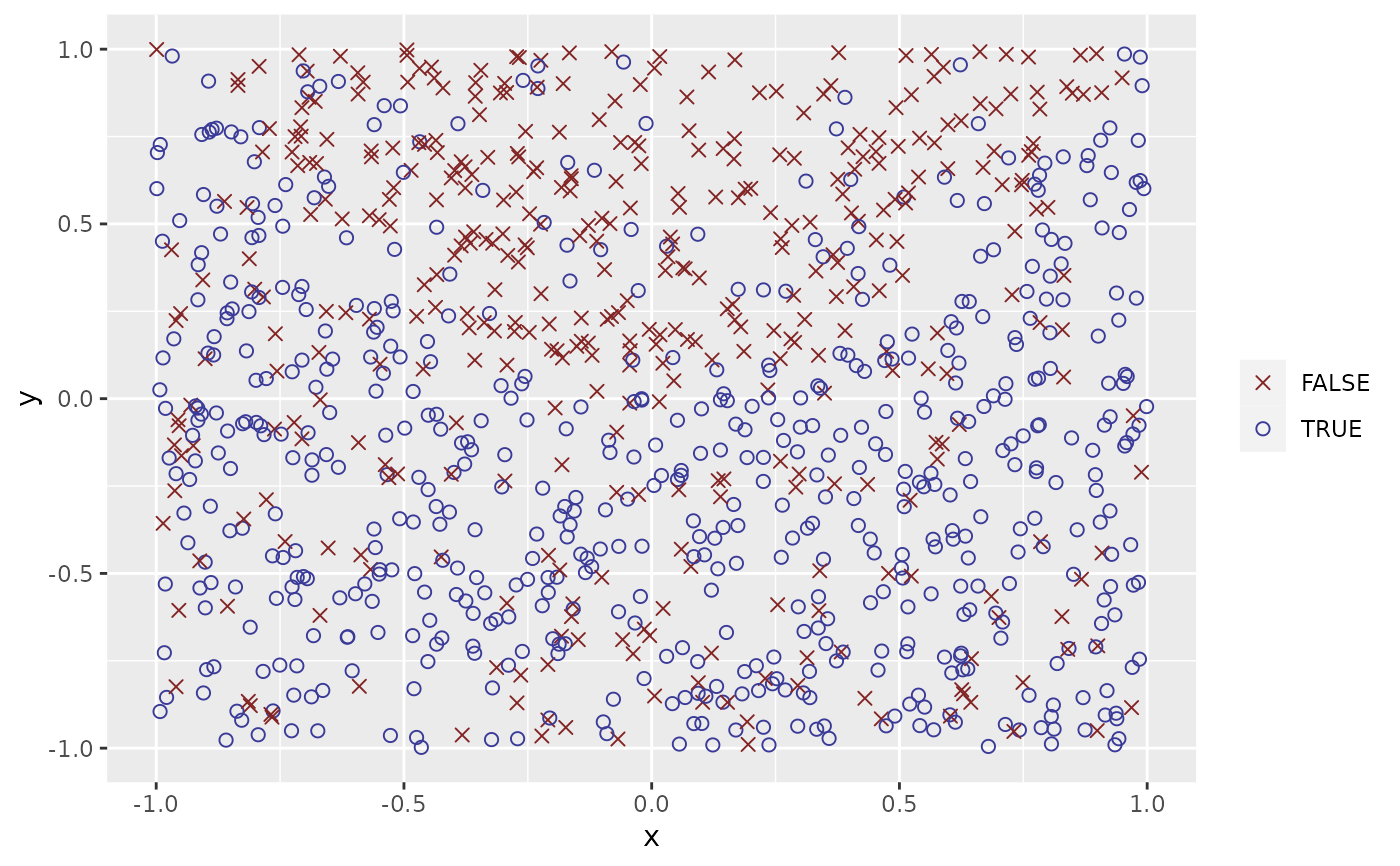
df <- sim_response_xy(n = 1000, relationship = function(x, y) x**2 > sin(y))
plot(df)
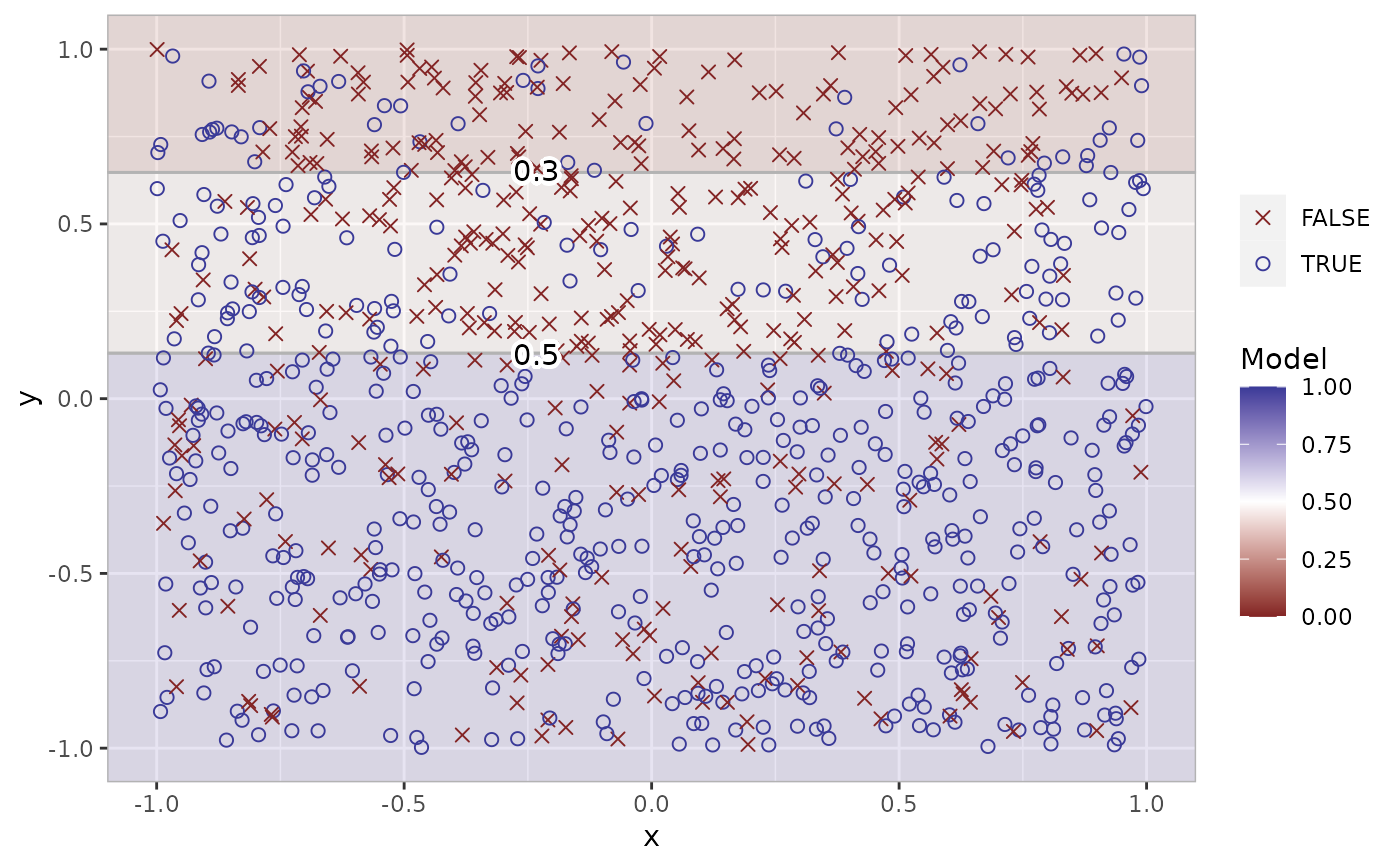
 # default type = "prob"
df_tree_prob <- fit_classification_tree(df)
df_tree_prob
#> # A tibble: 1,000 × 4
#> response x y prediction
#> <fct> <dbl> <dbl> <dbl>
#> 1 FALSE -0.425 -0.453 0.242
#> 2 FALSE 0.577 0.188 0.564
#> 3 FALSE -0.182 -0.680 0.242
#> 4 FALSE 0.766 0.707 0.746
#> 5 TRUE 0.881 0.695 0.746
#> 6 TRUE -0.909 -0.0442 0.242
#> 7 FALSE 0.0562 0.547 0.564
#> 8 FALSE 0.785 -0.409 0.242
#> 9 FALSE 0.103 -0.869 0.242
#> 10 TRUE -0.0868 -0.119 0.242
#> # ℹ 990 more rows
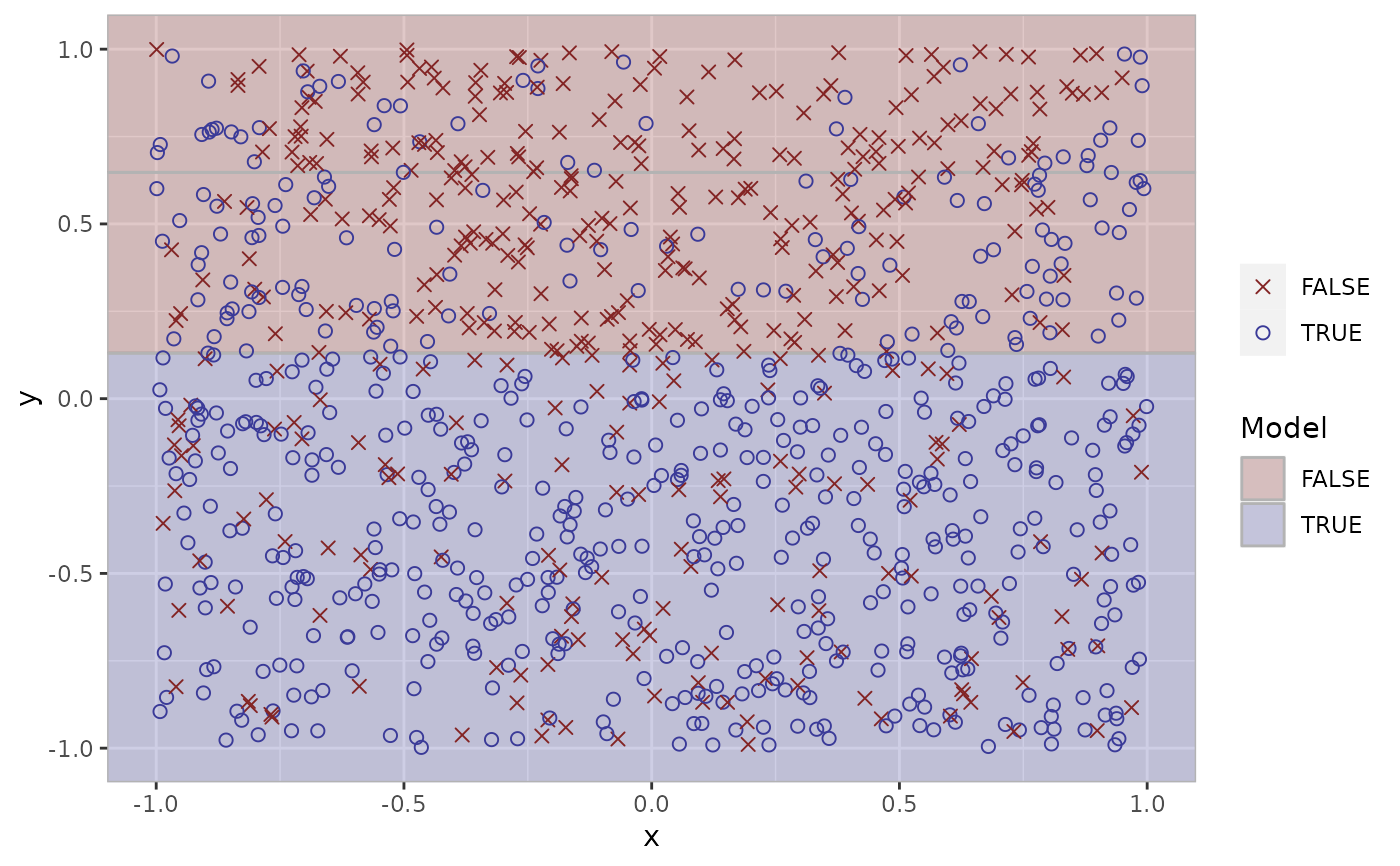
df_tree_resp <- fit_classification_tree(df, type = "response")
df_tree_resp
#> # A tibble: 1,000 × 4
#> response x y prediction
#> <fct> <dbl> <dbl> <fct>
#> 1 FALSE -0.425 -0.453 TRUE
#> 2 FALSE 0.577 0.188 FALSE
#> 3 FALSE -0.182 -0.680 TRUE
#> 4 FALSE 0.766 0.707 FALSE
#> 5 TRUE 0.881 0.695 FALSE
#> 6 TRUE -0.909 -0.0442 TRUE
#> 7 FALSE 0.0562 0.547 FALSE
#> 8 FALSE 0.785 -0.409 TRUE
#> 9 FALSE 0.103 -0.869 TRUE
#> 10 TRUE -0.0868 -0.119 TRUE
#> # ℹ 990 more rows
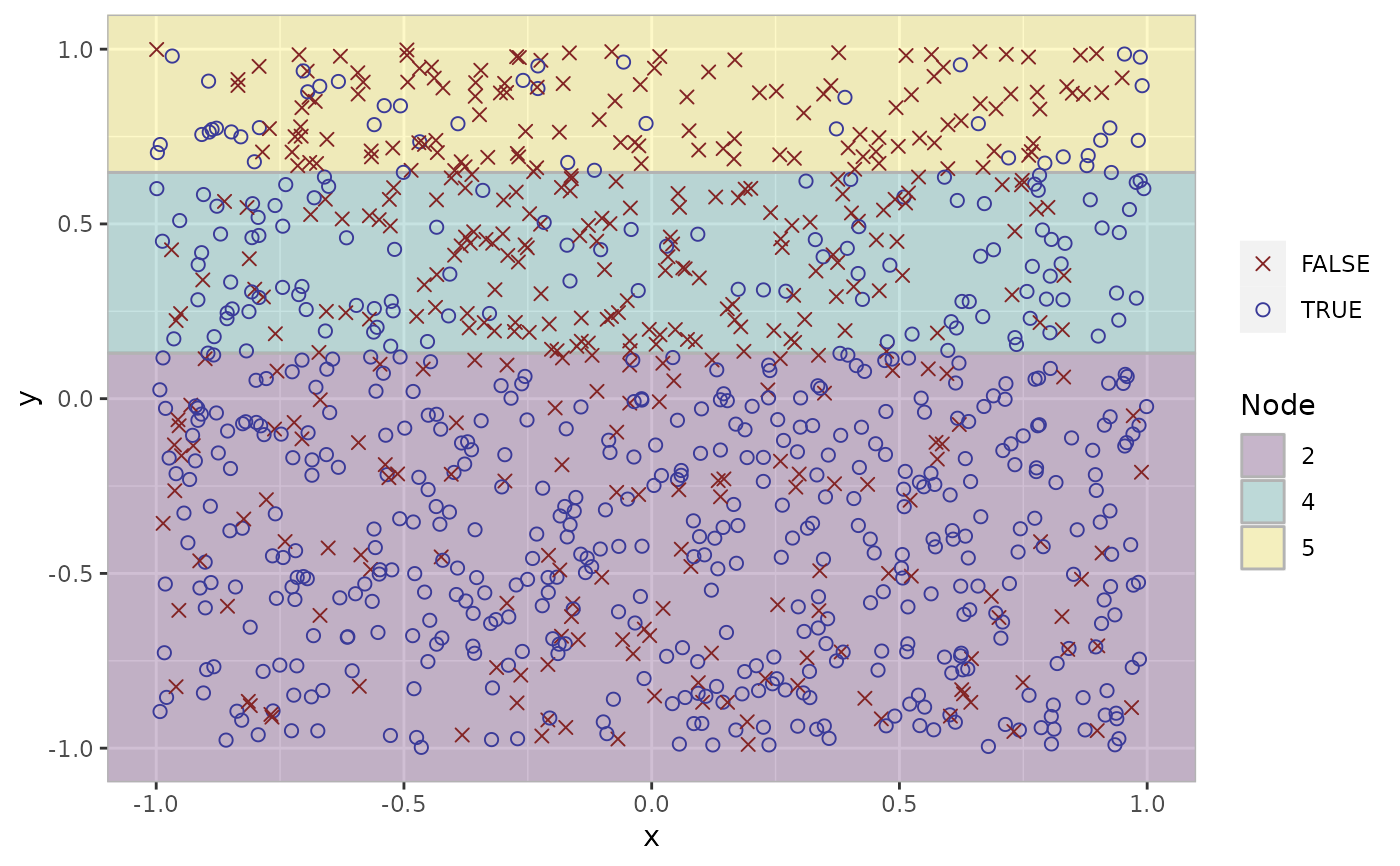
df_tree_node <- fit_classification_tree(df, type = "node")
df_tree_node
#> # A tibble: 1,000 × 4
#> response x y prediction
#> <fct> <dbl> <dbl> <int>
#> 1 FALSE -0.425 -0.453 2
#> 2 FALSE 0.577 0.188 4
#> 3 FALSE -0.182 -0.680 2
#> 4 FALSE 0.766 0.707 5
#> 5 TRUE 0.881 0.695 5
#> 6 TRUE -0.909 -0.0442 2
#> 7 FALSE 0.0562 0.547 4
#> 8 FALSE 0.785 -0.409 2
#> 9 FALSE 0.103 -0.869 2
#> 10 TRUE -0.0868 -0.119 2
#> # ℹ 990 more rows
plot(df_tree_prob)
#> Warning: Using `size` aesthetic for lines was deprecated in ggplot2 3.4.0.
#> ℹ Please use `linewidth` instead.
#> ℹ The deprecated feature was likely used in the klassets package.
#> Please report the issue at <https://github.com/jbkunst/klassets/issues>.
# default type = "prob"
df_tree_prob <- fit_classification_tree(df)
df_tree_prob
#> # A tibble: 1,000 × 4
#> response x y prediction
#> <fct> <dbl> <dbl> <dbl>
#> 1 FALSE -0.425 -0.453 0.242
#> 2 FALSE 0.577 0.188 0.564
#> 3 FALSE -0.182 -0.680 0.242
#> 4 FALSE 0.766 0.707 0.746
#> 5 TRUE 0.881 0.695 0.746
#> 6 TRUE -0.909 -0.0442 0.242
#> 7 FALSE 0.0562 0.547 0.564
#> 8 FALSE 0.785 -0.409 0.242
#> 9 FALSE 0.103 -0.869 0.242
#> 10 TRUE -0.0868 -0.119 0.242
#> # ℹ 990 more rows
df_tree_resp <- fit_classification_tree(df, type = "response")
df_tree_resp
#> # A tibble: 1,000 × 4
#> response x y prediction
#> <fct> <dbl> <dbl> <fct>
#> 1 FALSE -0.425 -0.453 TRUE
#> 2 FALSE 0.577 0.188 FALSE
#> 3 FALSE -0.182 -0.680 TRUE
#> 4 FALSE 0.766 0.707 FALSE
#> 5 TRUE 0.881 0.695 FALSE
#> 6 TRUE -0.909 -0.0442 TRUE
#> 7 FALSE 0.0562 0.547 FALSE
#> 8 FALSE 0.785 -0.409 TRUE
#> 9 FALSE 0.103 -0.869 TRUE
#> 10 TRUE -0.0868 -0.119 TRUE
#> # ℹ 990 more rows
df_tree_node <- fit_classification_tree(df, type = "node")
df_tree_node
#> # A tibble: 1,000 × 4
#> response x y prediction
#> <fct> <dbl> <dbl> <int>
#> 1 FALSE -0.425 -0.453 2
#> 2 FALSE 0.577 0.188 4
#> 3 FALSE -0.182 -0.680 2
#> 4 FALSE 0.766 0.707 5
#> 5 TRUE 0.881 0.695 5
#> 6 TRUE -0.909 -0.0442 2
#> 7 FALSE 0.0562 0.547 4
#> 8 FALSE 0.785 -0.409 2
#> 9 FALSE 0.103 -0.869 2
#> 10 TRUE -0.0868 -0.119 2
#> # ℹ 990 more rows
plot(df_tree_prob)
#> Warning: Using `size` aesthetic for lines was deprecated in ggplot2 3.4.0.
#> ℹ Please use `linewidth` instead.
#> ℹ The deprecated feature was likely used in the klassets package.
#> Please report the issue at <https://github.com/jbkunst/klassets/issues>.
 plot(df_tree_resp)
 plot(df_tree_node)