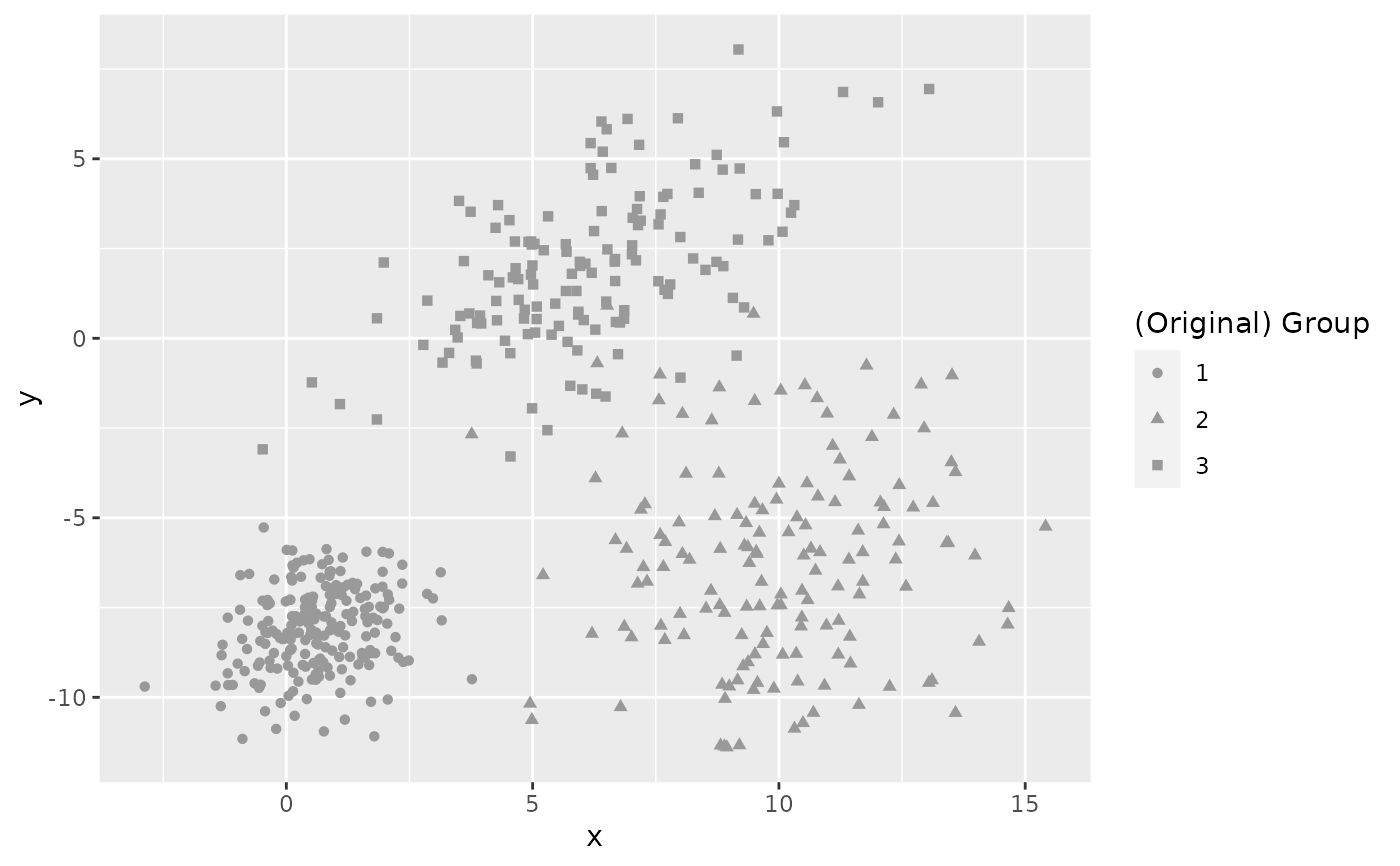
Generate data sets to apply clustering algorithms
Examples
set.seed(123456)

df <- sim_groups()

df
#> # A tibble: 500 × 3
#>    group     x     y
#>    <chr> <dbl> <dbl>
#>  1 1     0.729 -6.29
#>  2 1     1.19  -8.28
#>  3 1     0.915 -7.91
#>  4 1     1.22  -7.68
#>  5 1     1.07  -8.88
#>  6 1     0.117 -7.74
#>  7 1     1.59  -7.53
#>  8 1     1.62  -7.17
#>  9 1     0.108 -8.65
#> 10 1     0.333 -9.10
#> # ℹ 490 more rows

plot(df)


plot(sim_groups(500, 5))
