Javascript API Basics
Tom Bishop
2026-04-26
Source:vignettes/highchartsjs-api-basics.Rmd
highchartsjs-api-basics.RmdIntroduction
It’s very constructive to understand the relationship between the functions available in highcharter and the underlying highchartsJS API in more detail. Understanding the relationship will allow you to:
- Search for all the available chart customisation options implemented
as arguments in the various
highcharterfunctions. - Reverse engineer R implementations of any
highchartschart you see created in javascript instead of R. - Use the javascript API reference
documentation directly to help you build your
highchartscharts in R.
To explore this relationship, we’ll be looking at the Palmer penguins dataset.
library(palmerpenguins)

head(penguins)
## # A tibble: 6 × 8
## species island bill_length_mm bill_depth_mm flipper_length_mm body_mass_g
## <fct> <fct> <dbl> <dbl> <int> <int>
## 1 Adelie Torgersen 39.1 18.7 181 3750
## 2 Adelie Torgersen 39.5 17.4 186 3800
## 3 Adelie Torgersen 40.3 18 195 3250
## 4 Adelie Torgersen NA NA NA NA
## 5 Adelie Torgersen 36.7 19.3 193 3450
## 6 Adelie Torgersen 39.3 20.6 190 3650
## # ℹ 2 more variables: sex <fct>, year <int>Let’s first assume that we have a base chart with some visualisation of a dataset. To build a scatter plot of the Palmer penguins’ bill length vs flipper length split by species we would use the following code:
library(highcharter)

hc <- hchart(
  penguins,
  "scatter",
  hcaes(x = bill_length_mm, y = flipper_length_mm, group = species)
)

hc
Example
Suppose we want to customise the chart legend on our
highchart. Let’s say we want to: place the legend inside
the plot area, arrange the legend entries in a vertical arrangement, and
add a title to the legend.
Let’s check the documentation of the hc_legend() with
?hc_legend function in R to see how we could go about
that.
?hc_legend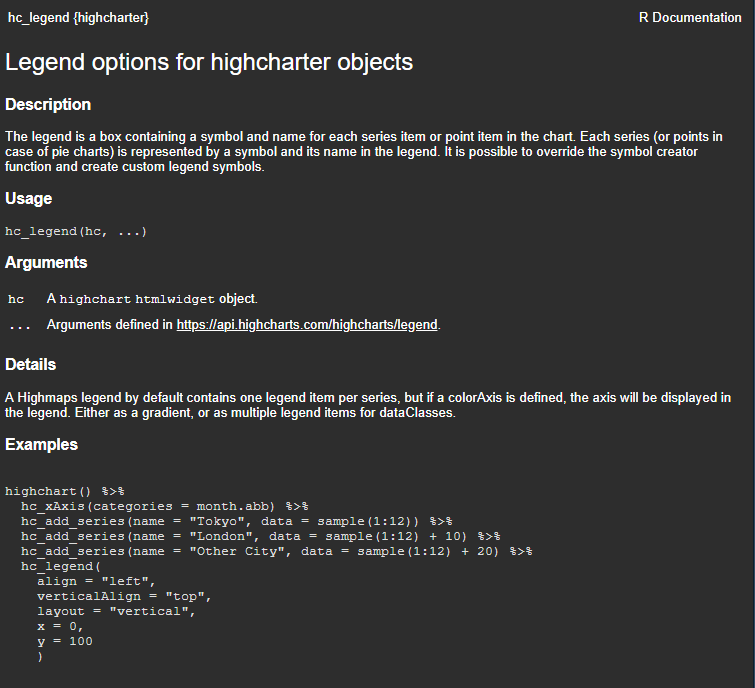
Forgetting the examples for now, the R help suggests no specific
arguments for a highcharts legend at all. It’s not
immediately obvious what’s required or valid as an input to the
hc_legend() function, let alone how we could add the exact
customisations that we want to our basic chart. What is provided is a
link to the legend section of the highcharts API
documentation which can be found here a screenshot
of which is below.
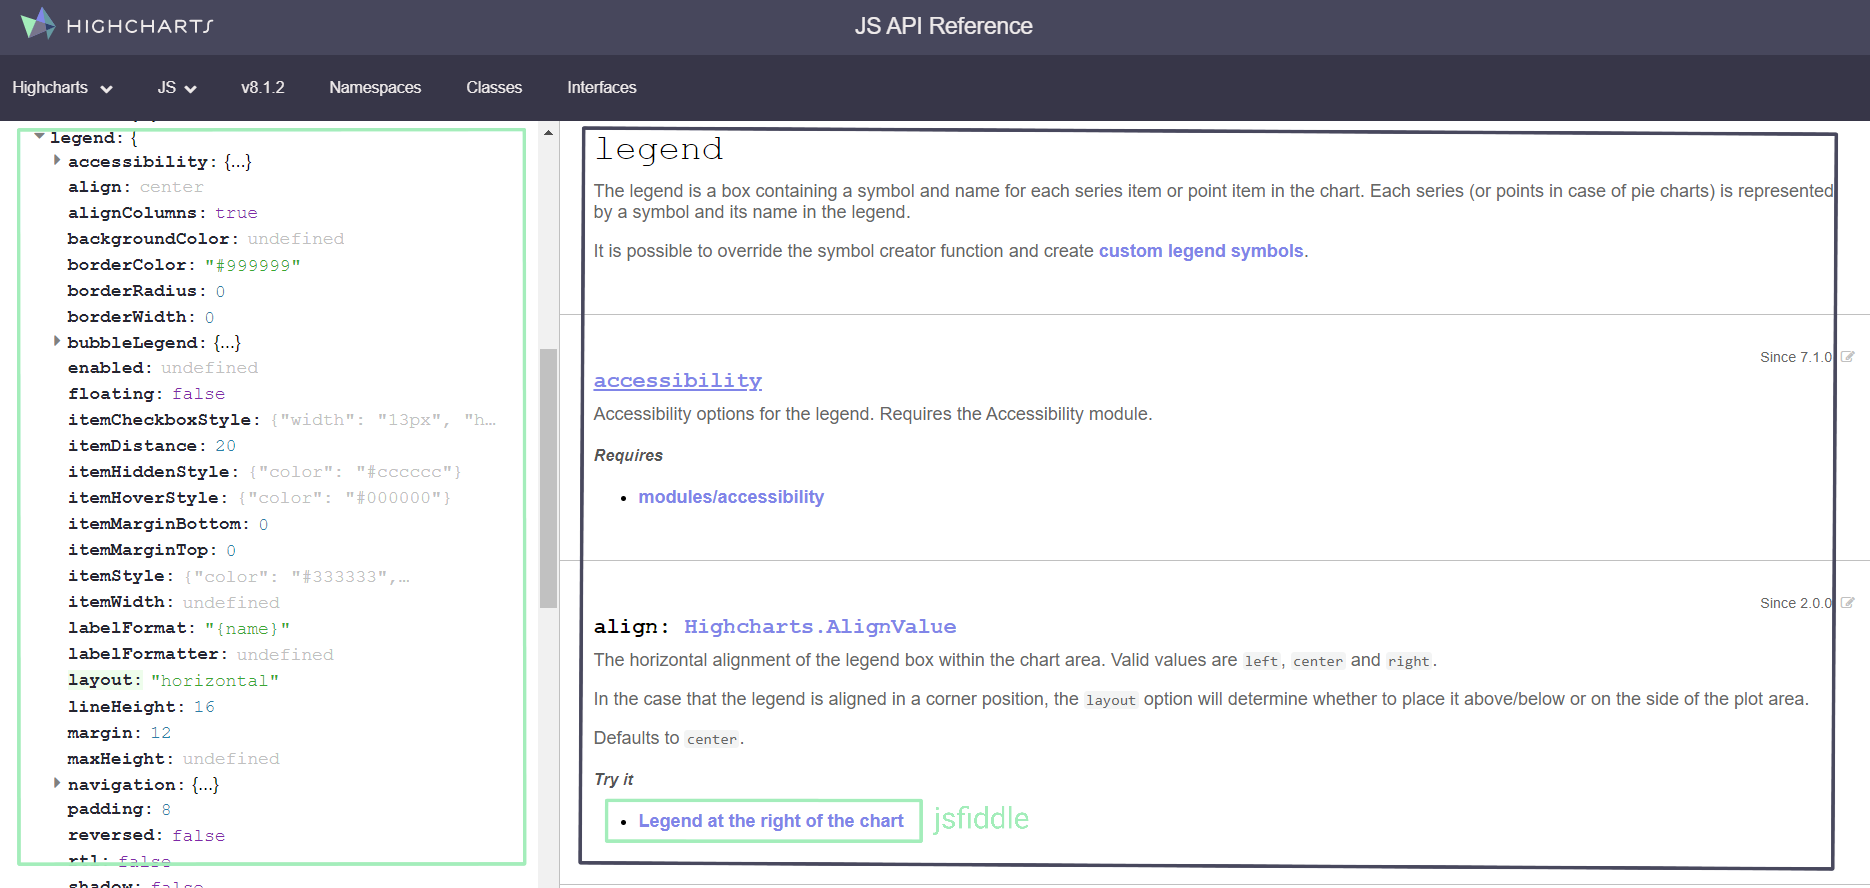
The properties in the green box are an exhaustive list of the
arguments (there are more than those shown) available for a
highcharts legend. On the right each argument has a short
description, definition of valid argument values and sometimes a link to
an example (powered by JSFiddle) where you can see the argument being
used in a real chart.
Searching through the list of options the layout
property looks like the right option to control the item arrangement,
which we can confirm by clicking through to the JSFiddle example.
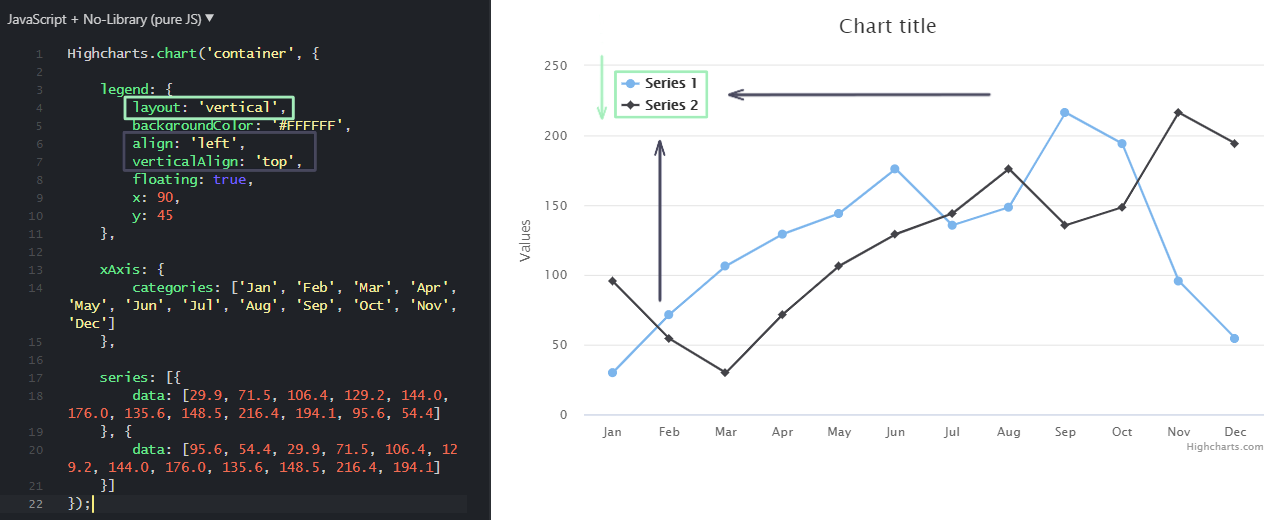
JSFiddle provides a self-contained environment to see and tweak
javascript highcharts and it’s helpful to see exactly what
each argument does. Below we can see the layout does indeed
reorient the legend items and in this example we also see handily that
verticalAlign moves the legend up and down the chart area
and align performs the same operation horizontally.
So it seems that the right set of legend properties we need to adjust in the legend are:
-
layout,align,verticalAlignas we see above. -
floatingallows the legend to float within the plot area. -
xandyare manual vertical adjustments in pixels we can use to lift the legend to just inside the chart area.
To adjust these properties in R (where the properties are single strings or numbers) it’s a direct translation from javascript property to R function argument like so:
hc |>
  hc_legend(
    layout = "vertical",
    align = "left",
    verticalAlign = "top",
    floating = TRUE,
    x = 90,
    y = 45
    )
Halfway there, now we just need to add the legend title. There are
some arguments in the API documentation that look like sets of nested
properties. Importantly for this exercise, the title
argument look exactly like one of these properties.
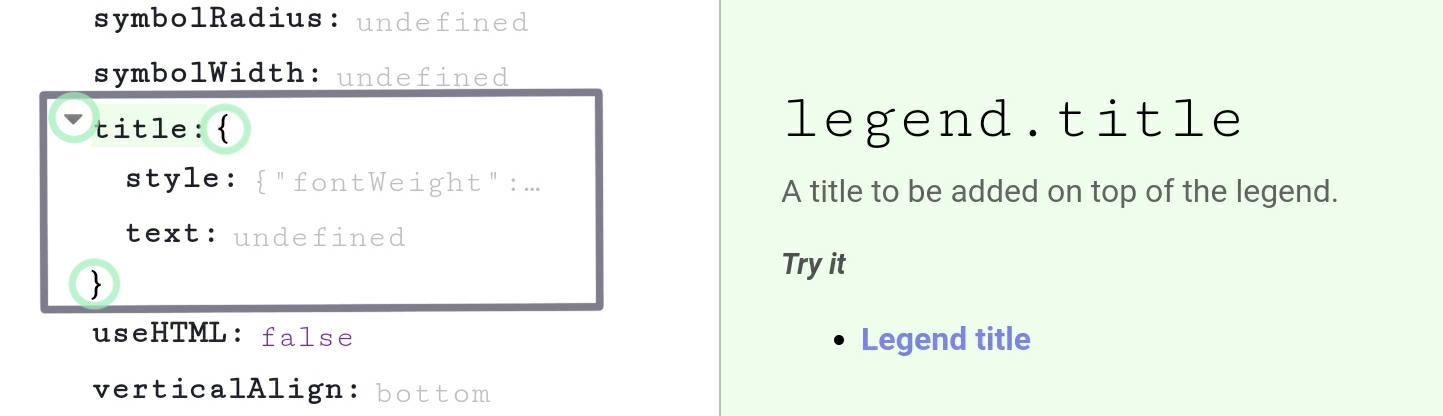
The drop-down + curly braces (highlighted in green) on an argument
like this tell you that what highcharts expects here is a
self-contained set of properties that sit within the border property
set. In this case the title property takes two arguments
text and style which define the title text of
the legend and the legend title CSS style respectively.
To correctly create this hierarchical set of properties within the R
hc_legend() function we need to use named lists. Each time
the API documentation defines an property to be it’s own self-contained
object within a broader set of properties you simply open a new list in
your R function call. This will mean that sometimes the values provided
to arguments within highcharter functions are nested lists
with 2 or even 3 levels. This can seem complicated, but having the API
documentation as a reference makes the process trivially easy.
Style is a special set of properties, not enumerated in the documentation, that apply any CSS style to a given chart component. Putting this all together alongside the previous adjustments: defining the legend header text and adding an underline to the legend header (with a CSS property) looks like this:
hc |>
  hc_legend(
    layout = "vertical",
    align = "left",
    verticalAlign = "top",
    floating = TRUE,
    x = 90,
    y = 45,
    title = list(
      text = "Species",
      style = list(
        textDecoration = "underline"
        )
      )
    )
CSS properties are often hyphenated words (like
text-decoration) which won’t play nicely in R lists so you
should define any CSS properties in your R lists with camel case version
of these property names (eg. textDecoration).
Conclusion
The many functions built for the highcharter package are closely coupled to options and classes available for the javascript library. These options are very well documented in the extensive highchartsJS API reference documentation. Loosely understanding this coupling: how functions and their arguments map to build JSON objects that define javascript Highcharts should supercharge your use of the R package.